

Question: Prices.csv This data represents basic US equity market data for each date August 1, 2013-July 29, 2015. Variable dateformatted date VIXopen VIXhigh VIXlow VIXclose SPXopen
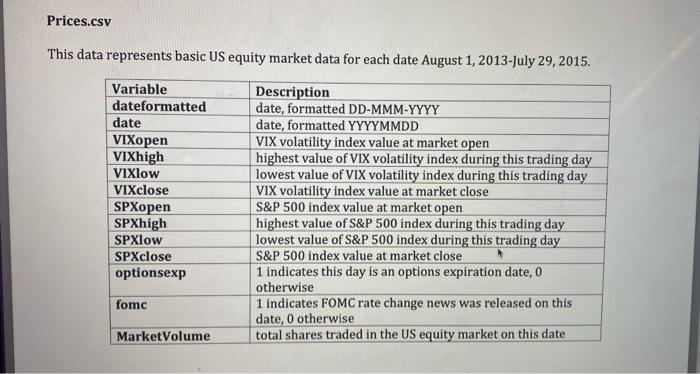
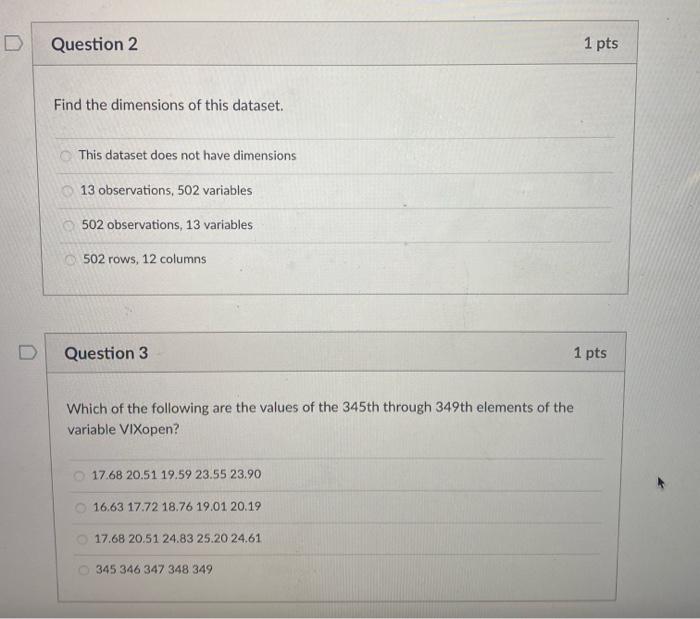
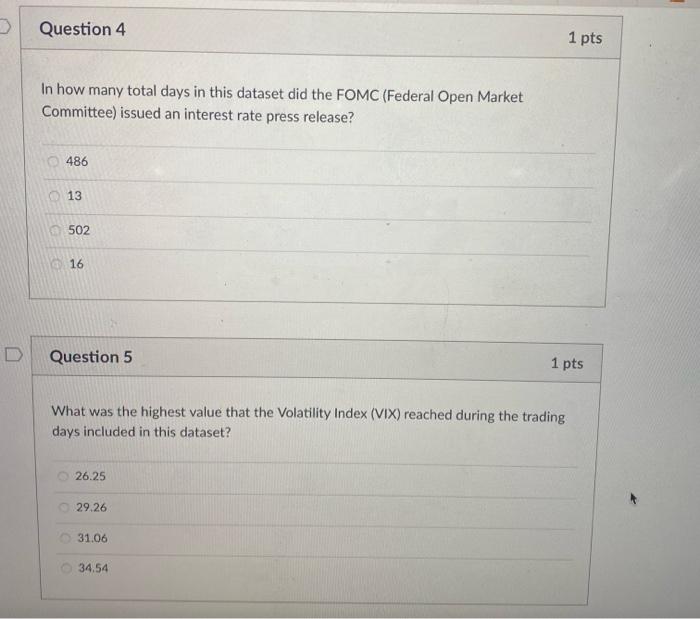
Prices.csv This data represents basic US equity market data for each date August 1, 2013-July 29, 2015. Variable dateformatted date VIXopen VIXhigh VIXlow VIXclose SPXopen SPXhigh SPXlow SPXclose optionsexp Description date, formatted DD-MMM-YYYY date, formatted YYYYMMDD VIX volatility index value at market open highest value of VIX volatility index during this trading day lowest value of VIX volatility index during this trading day VIX volatility index value at market close S&P 500 index value at market open highest value of S&P 500 index during this trading day lowest value of S&P 500 index during this trading day S&P 500 index value at market close 1 indicates this day is an options expiration date, 0 otherwise 1 indicates FOMC rate change news was released on this date, 0 otherwise total shares traded in the US equity market on this date fomc Market Volume D Question 2 1 pts Find the dimensions of this dataset. This dataset does not have dimensions 13 observations, 502 variables 502 observations, 13 variables 502 rows, 12 columns D Question 3 1 pts Which of the following are the values of the 345th through 349th elements of the variable VIXopen? 17.68 20.51 19.59 23.55 23.90 16.63 17.72 18.76 19.01 20:19 17.68 20.51 24.83 25.20 24.61 345 346 347 348 349 Question 4 1 pts In how many total days in this dataset did the FOMC (Federal Open Market Committee) issued an interest rate press release? 486 13 502 16 Question 5 1 pts What was the highest value that the Volatility Index (VIX) reached during the trading days included in this dataset? 26.25 29.26 31.06 34.54 Prices.csv This data represents basic US equity market data for each date August 1, 2013-July 29, 2015. Variable dateformatted date VIXopen VIXhigh VIXlow VIXclose SPXopen SPXhigh SPXlow SPXclose optionsexp Description date, formatted DD-MMM-YYYY date, formatted YYYYMMDD VIX volatility index value at market open highest value of VIX volatility index during this trading day lowest value of VIX volatility index during this trading day VIX volatility index value at market close S&P 500 index value at market open highest value of S&P 500 index during this trading day lowest value of S&P 500 index during this trading day S&P 500 index value at market close 1 indicates this day is an options expiration date, 0 otherwise 1 indicates FOMC rate change news was released on this date, 0 otherwise total shares traded in the US equity market on this date fomc Market Volume D Question 2 1 pts Find the dimensions of this dataset. This dataset does not have dimensions 13 observations, 502 variables 502 observations, 13 variables 502 rows, 12 columns D Question 3 1 pts Which of the following are the values of the 345th through 349th elements of the variable VIXopen? 17.68 20.51 19.59 23.55 23.90 16.63 17.72 18.76 19.01 20:19 17.68 20.51 24.83 25.20 24.61 345 346 347 348 349 Question 4 1 pts In how many total days in this dataset did the FOMC (Federal Open Market Committee) issued an interest rate press release? 486 13 502 16 Question 5 1 pts What was the highest value that the Volatility Index (VIX) reached during the trading days included in this dataset? 26.25 29.26 31.06 34.54
Step by Step Solution
There are 3 Steps involved in it

Get step-by-step solutions from verified subject matter experts