

Question: Primary Task Response: Write a brief paper in APA format of 500-1000 words that respond to the following questions with your thoughts, ideas, and comments.
Primary Task Response:Write a brief paper in APA format of 500-1000 words that respond to the following questions with your thoughts, ideas, and comments. Be substantive and clear, and include the tables below to support your findings. Refer to the APA Sample Research Paper as a template for your write up.A survey was conducted to analyze the debt of individuals in the United States. A researcher obtained this secondary data and ran Chi-Square and Crosstabulation analyses to determine if people who defaulted on loans is associated the level of education they completed. Additionally, the researcher wanted to determine which education level(s) are more likely to default on a loan. The results of his analyses are provided below.
Write the Results section of the paper and present the results using appropriate APA-formatted tables and figures. Include one research question and one set of an aligned null and alternative hypothesis to address the research goals outlined above. Follow all APA conventions and include the proper APA statistical notation. A clustered bar chart comparing the number of people who defaulted or did not default on a loan, for each education level, is included to help the reader visualized the data and should be included in your paper as an APA-formatted figure.
Please refer to the tables below:

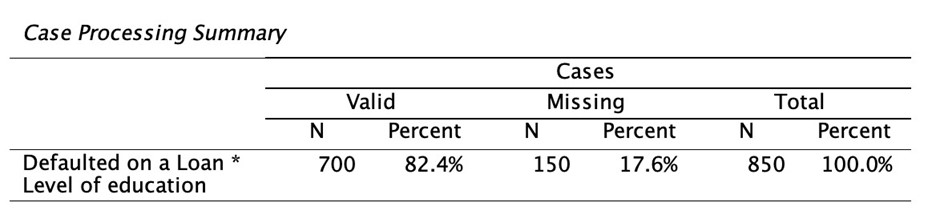
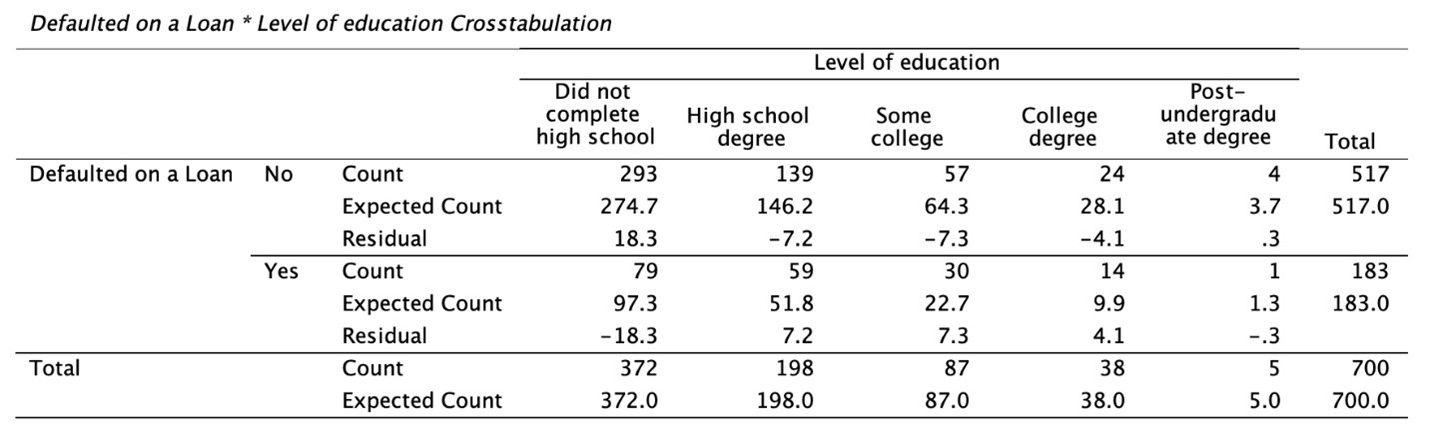
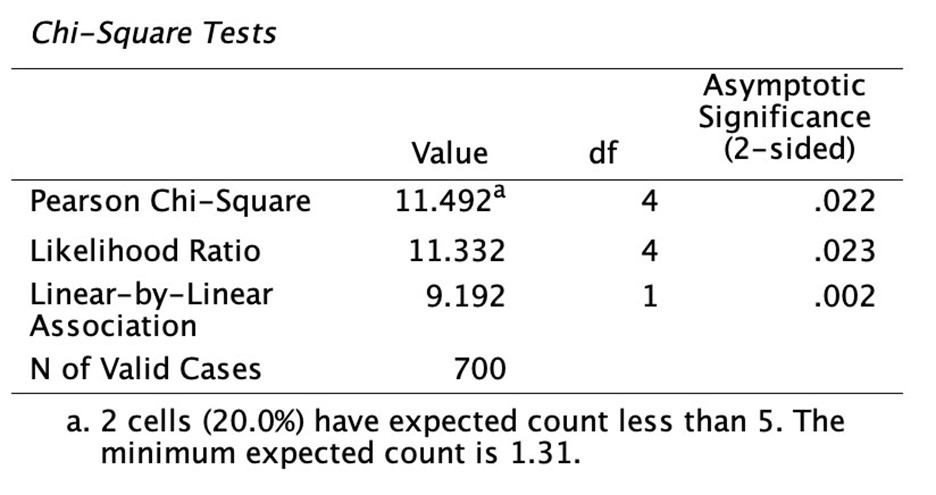
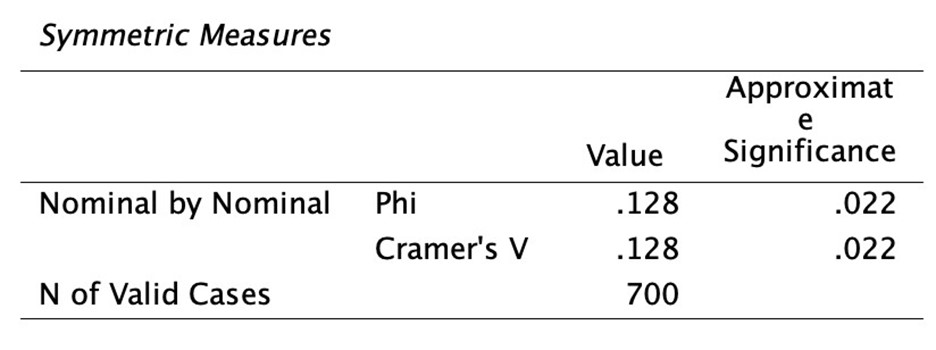
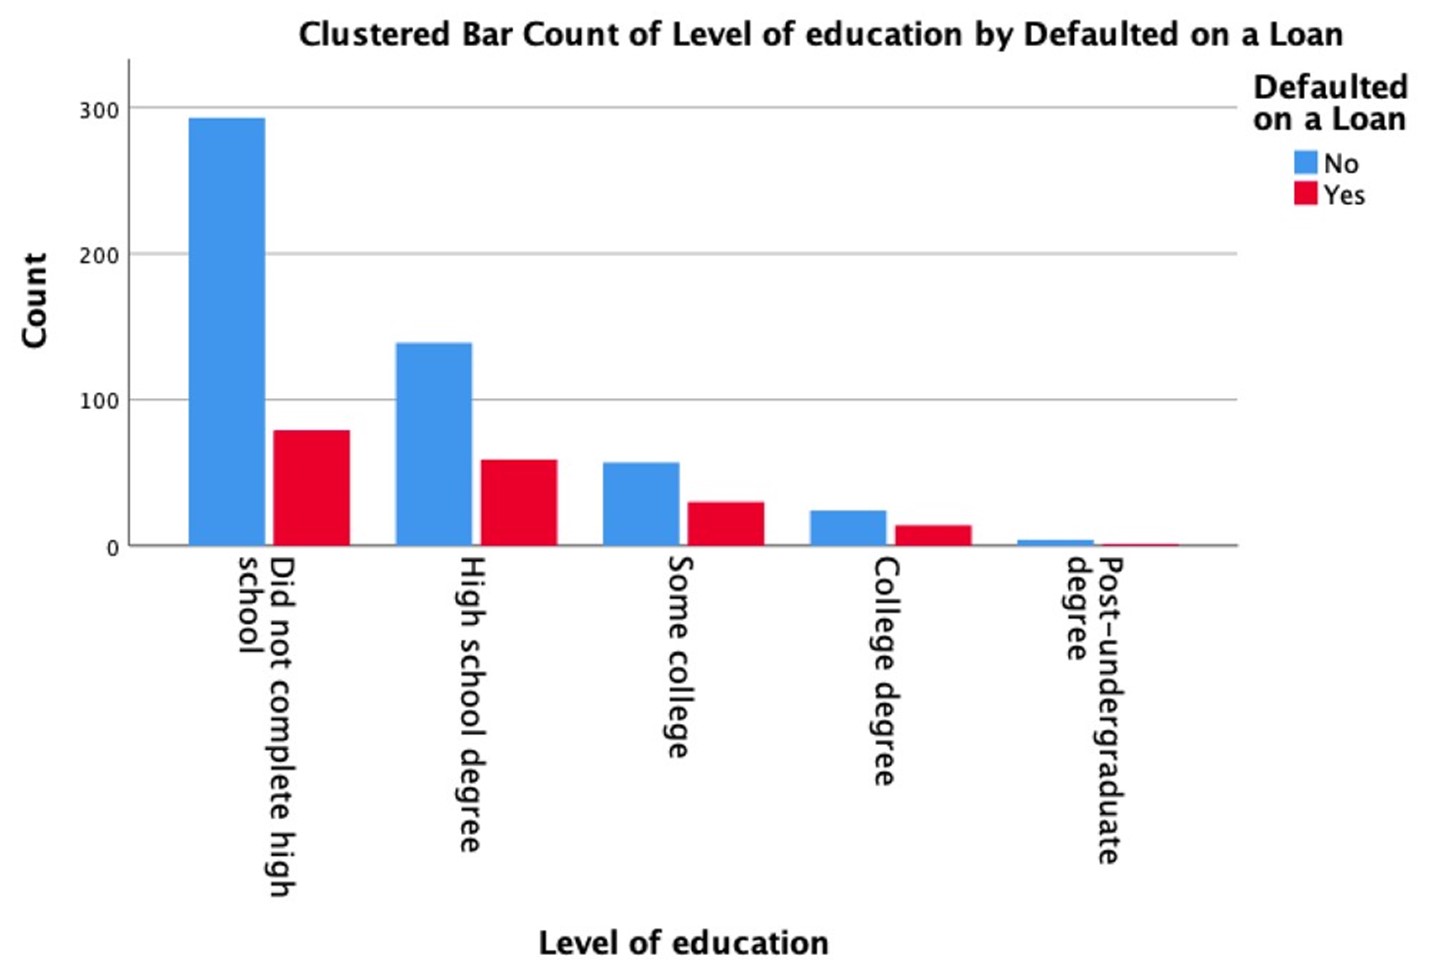
\fCase Processing Summary Cases Valid Missing Total N Percent N Percent N Percent Defaulted on a Loan * 700 82.4% 150 17.6% 850 100.0% Level of education Defaulted on a Loan * Level of education Cross tabulation Level of education Did not Post- complete High school Some College undergradu high school degree college degree ate degree Total Defaulted on a Loan No Count 293 139 57 24 4 517 Expected Count 274.7 146.2 64.3 28.1 3.7 517.0 Residual 18.3 -7.2 -7.3 -4.1 .3 Yes Count 79 59 30 14 1 183 Expected Count 97.3 51.8 22.7 9.9 1.3 183.0 Residual 18.3 7.2 7.3 4.1 .3 Total Count 372 198 B7 38 5 700 Expected Count 372.0 193.0 87.0 38.0 5.0 700.0 Chi-Square Tests Asymptotic Significance Value df (2-sided) Pearson Chi-Square 11.492a 4 022 Likelihood Ratio 11.332 4 .023 Linear-by-Linear 9.192 002 Association N of Valid Cases 700 a. 2 cells (20.0%) have expected count less than 5. The minimum expected count is 1.31.Symmetric Measures Approximat e Value Significance Nominal by Nominal Phi . 128 .022 Cramer's V .128 022 N of Valid Cases 700Clustered Bar Count of Level of education by Defaulted on a Loan 300 Defaulted on a Loan No Yes 200 Count 100 school degree Some college College degree High school degree Post-undergraduate Did not complete high Level of education
Step by Step Solution
There are 3 Steps involved in it

Get step-by-step solutions from verified subject matter experts