

Question: Probability Plot of RESI_1 Normal 99.9 Mean 1.580247E-14 StDev 0.3675 99 N 125 AD 0.464 95 P-Value 0.252 90 Percent 8 8 86588 8 1
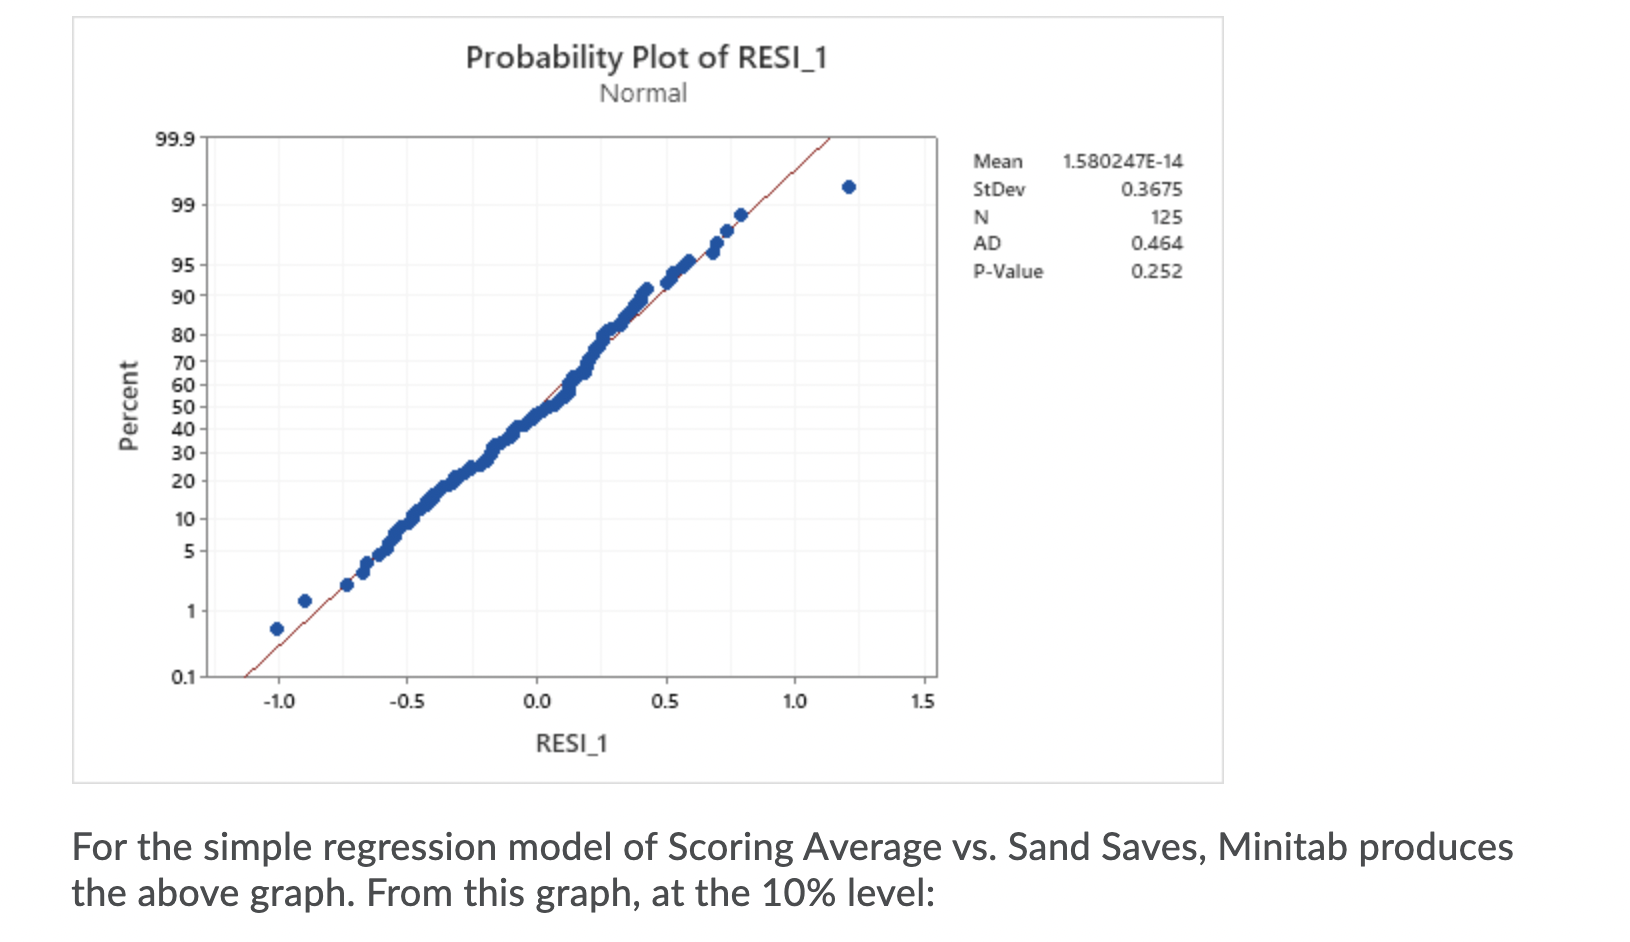
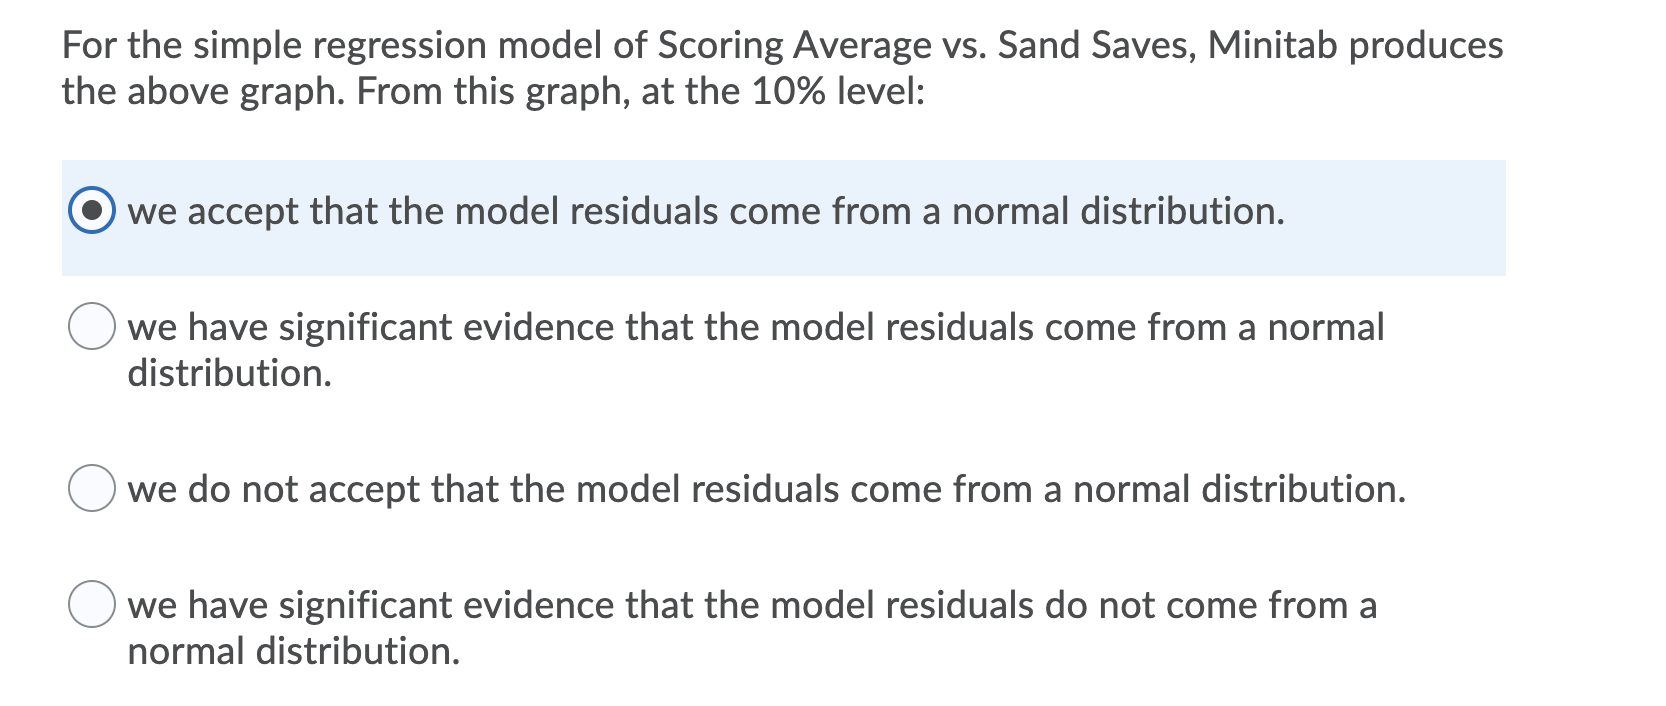
Probability Plot of RESI_1 Normal 99.9 Mean 1.580247E-14 StDev 0.3675 99 N 125 AD 0.464 95 P-Value 0.252 90 Percent 8 8 86588 8 1 0.1 -1.0 0.5 0.0 0.5 1.0 1.5 RESI 1 For the simple regression model of Scoring Average vs. Sand Saves, Minitab produces the above graph. From this graph, at the 10% level:For the simple regression model of Scoring Average vs. Sand Saves, Minitab produces the above graph. From this graph, at the 10% level: (9 we accept that the model residuals come from a normal distribution. 0 we have significant evidence that the model residuals come from a normal distribution. 0 we do not accept that the model residuals come from a normal distribution. 0 we have significant evidence that the model residuals do not come from a normal distribution
Step by Step Solution
There are 3 Steps involved in it

Get step-by-step solutions from verified subject matter experts