

Question: Problem 0 5 _ 0 5 : 3 - D Bar Plot Use the function bar 3 to generate a 3 - D bar plot
Problem: D Bar Plot
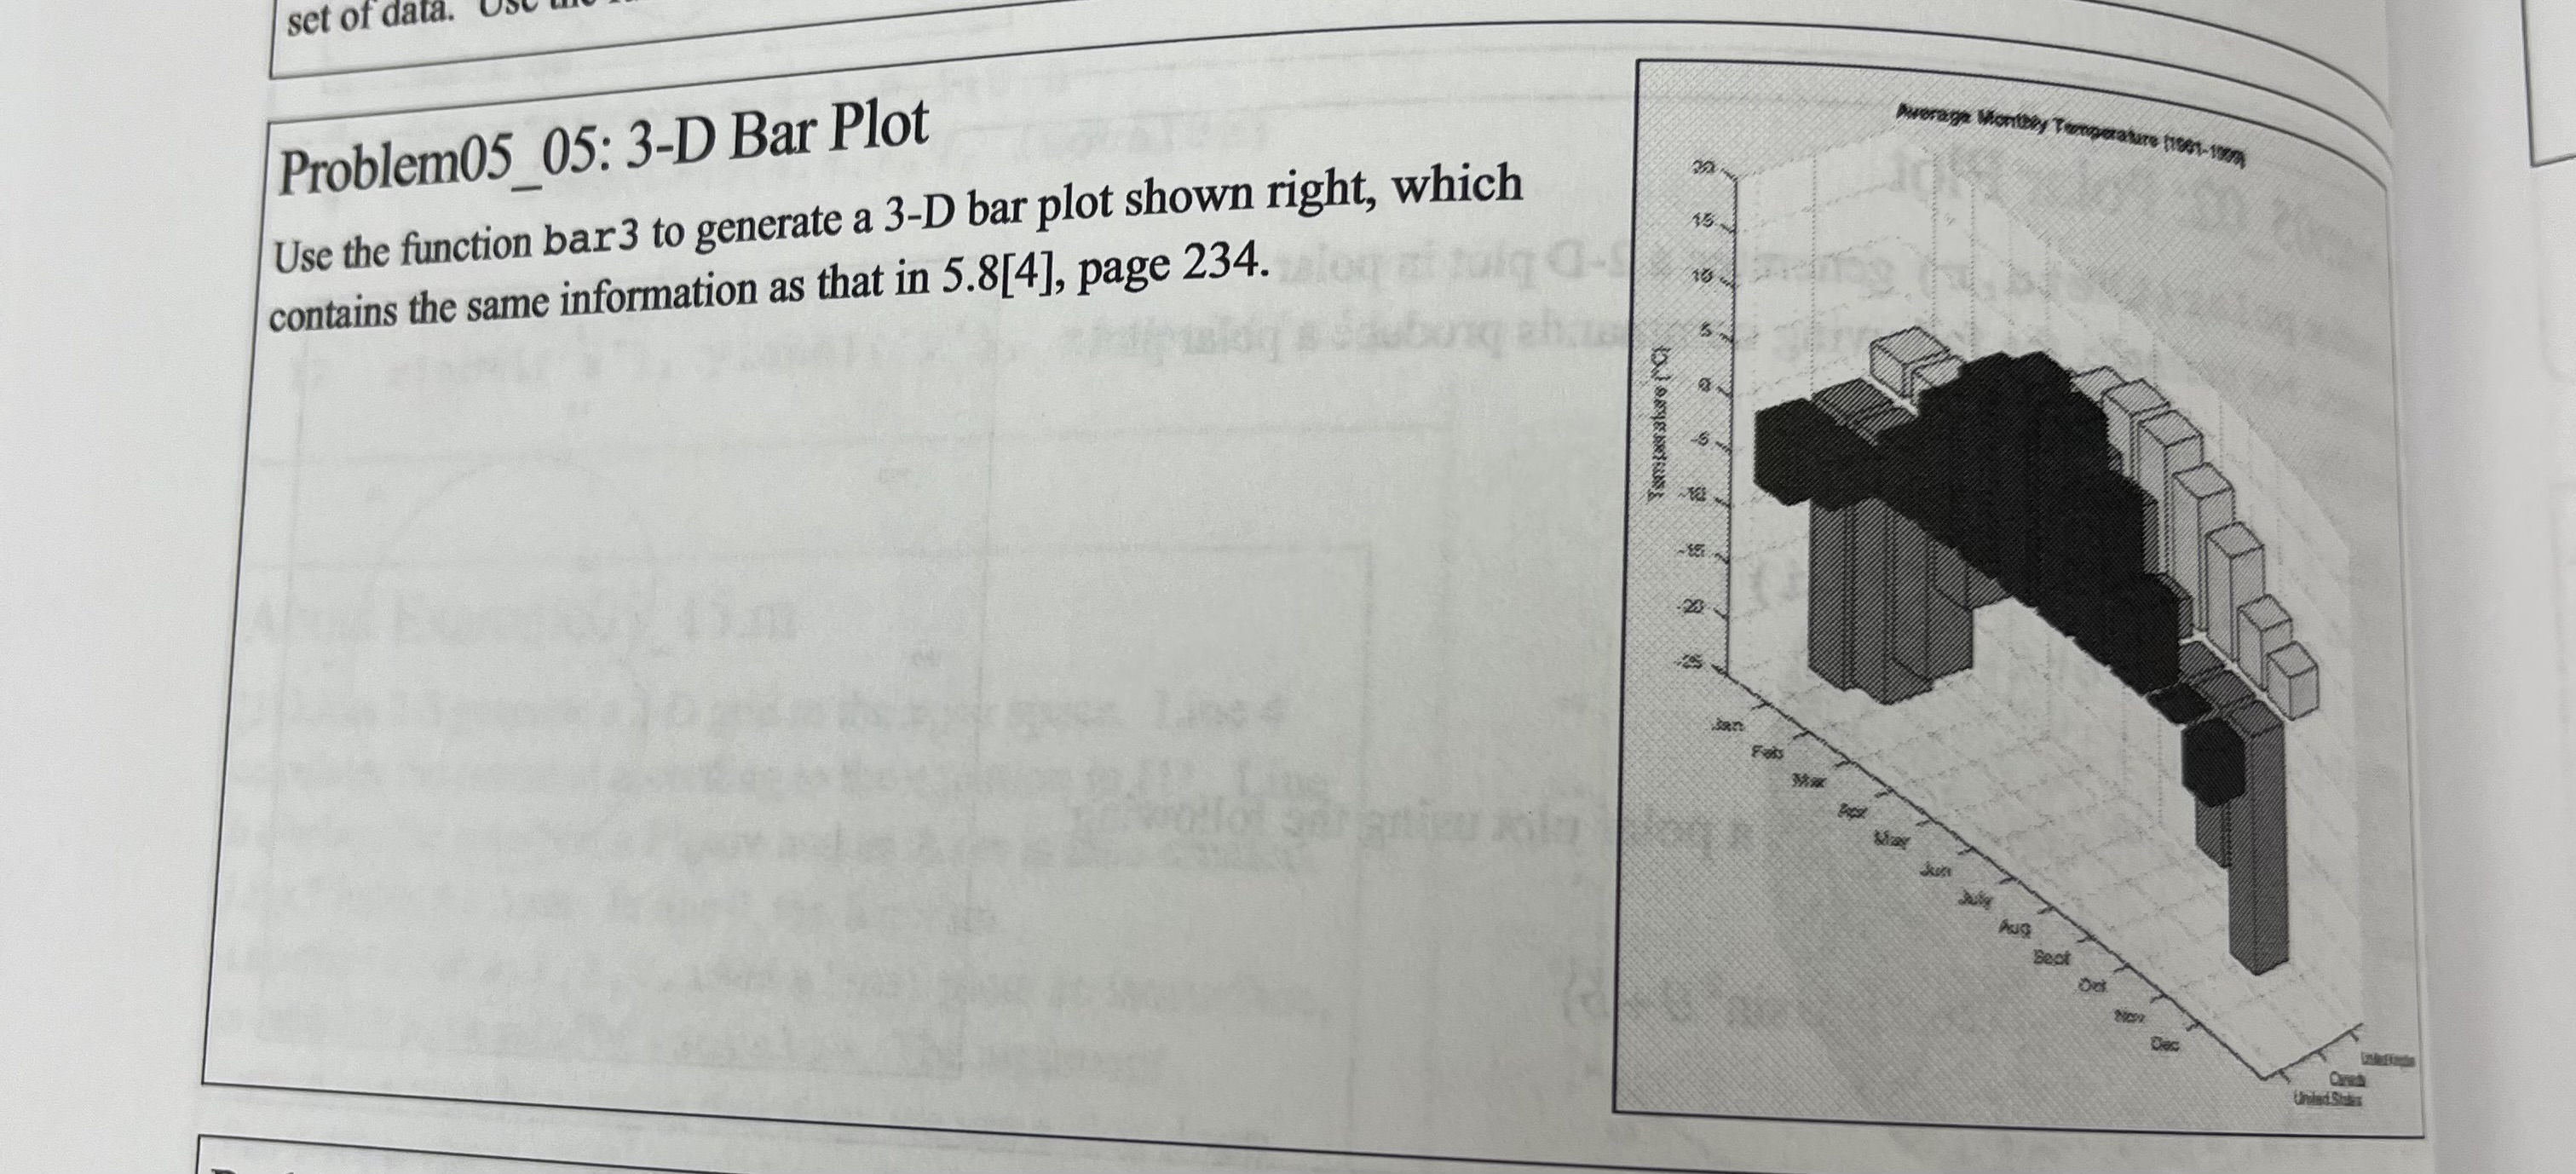
Use the function bar to generate a D bar plot shown right, which contains the same information as that in page At the end of Example m
Figure looks like this. #
Details and More: Help MATLAB Graphics D and D Plots Pie Charts, Bar Plots, and Histograms
Details and More:
Step by Step Solution
There are 3 Steps involved in it
1 Expert Approved Answer
Step: 1 Unlock

Question Has Been Solved by an Expert!
Get step-by-step solutions from verified subject matter experts
Step: 2 Unlock
Step: 3 Unlock