

Question: Problem 1 ( 1 5 points ) ( Solve using Excel ) Eastport Manufacturing Company has demand for excavators over the period 2 0 0
Problem pointsSolve using Excel
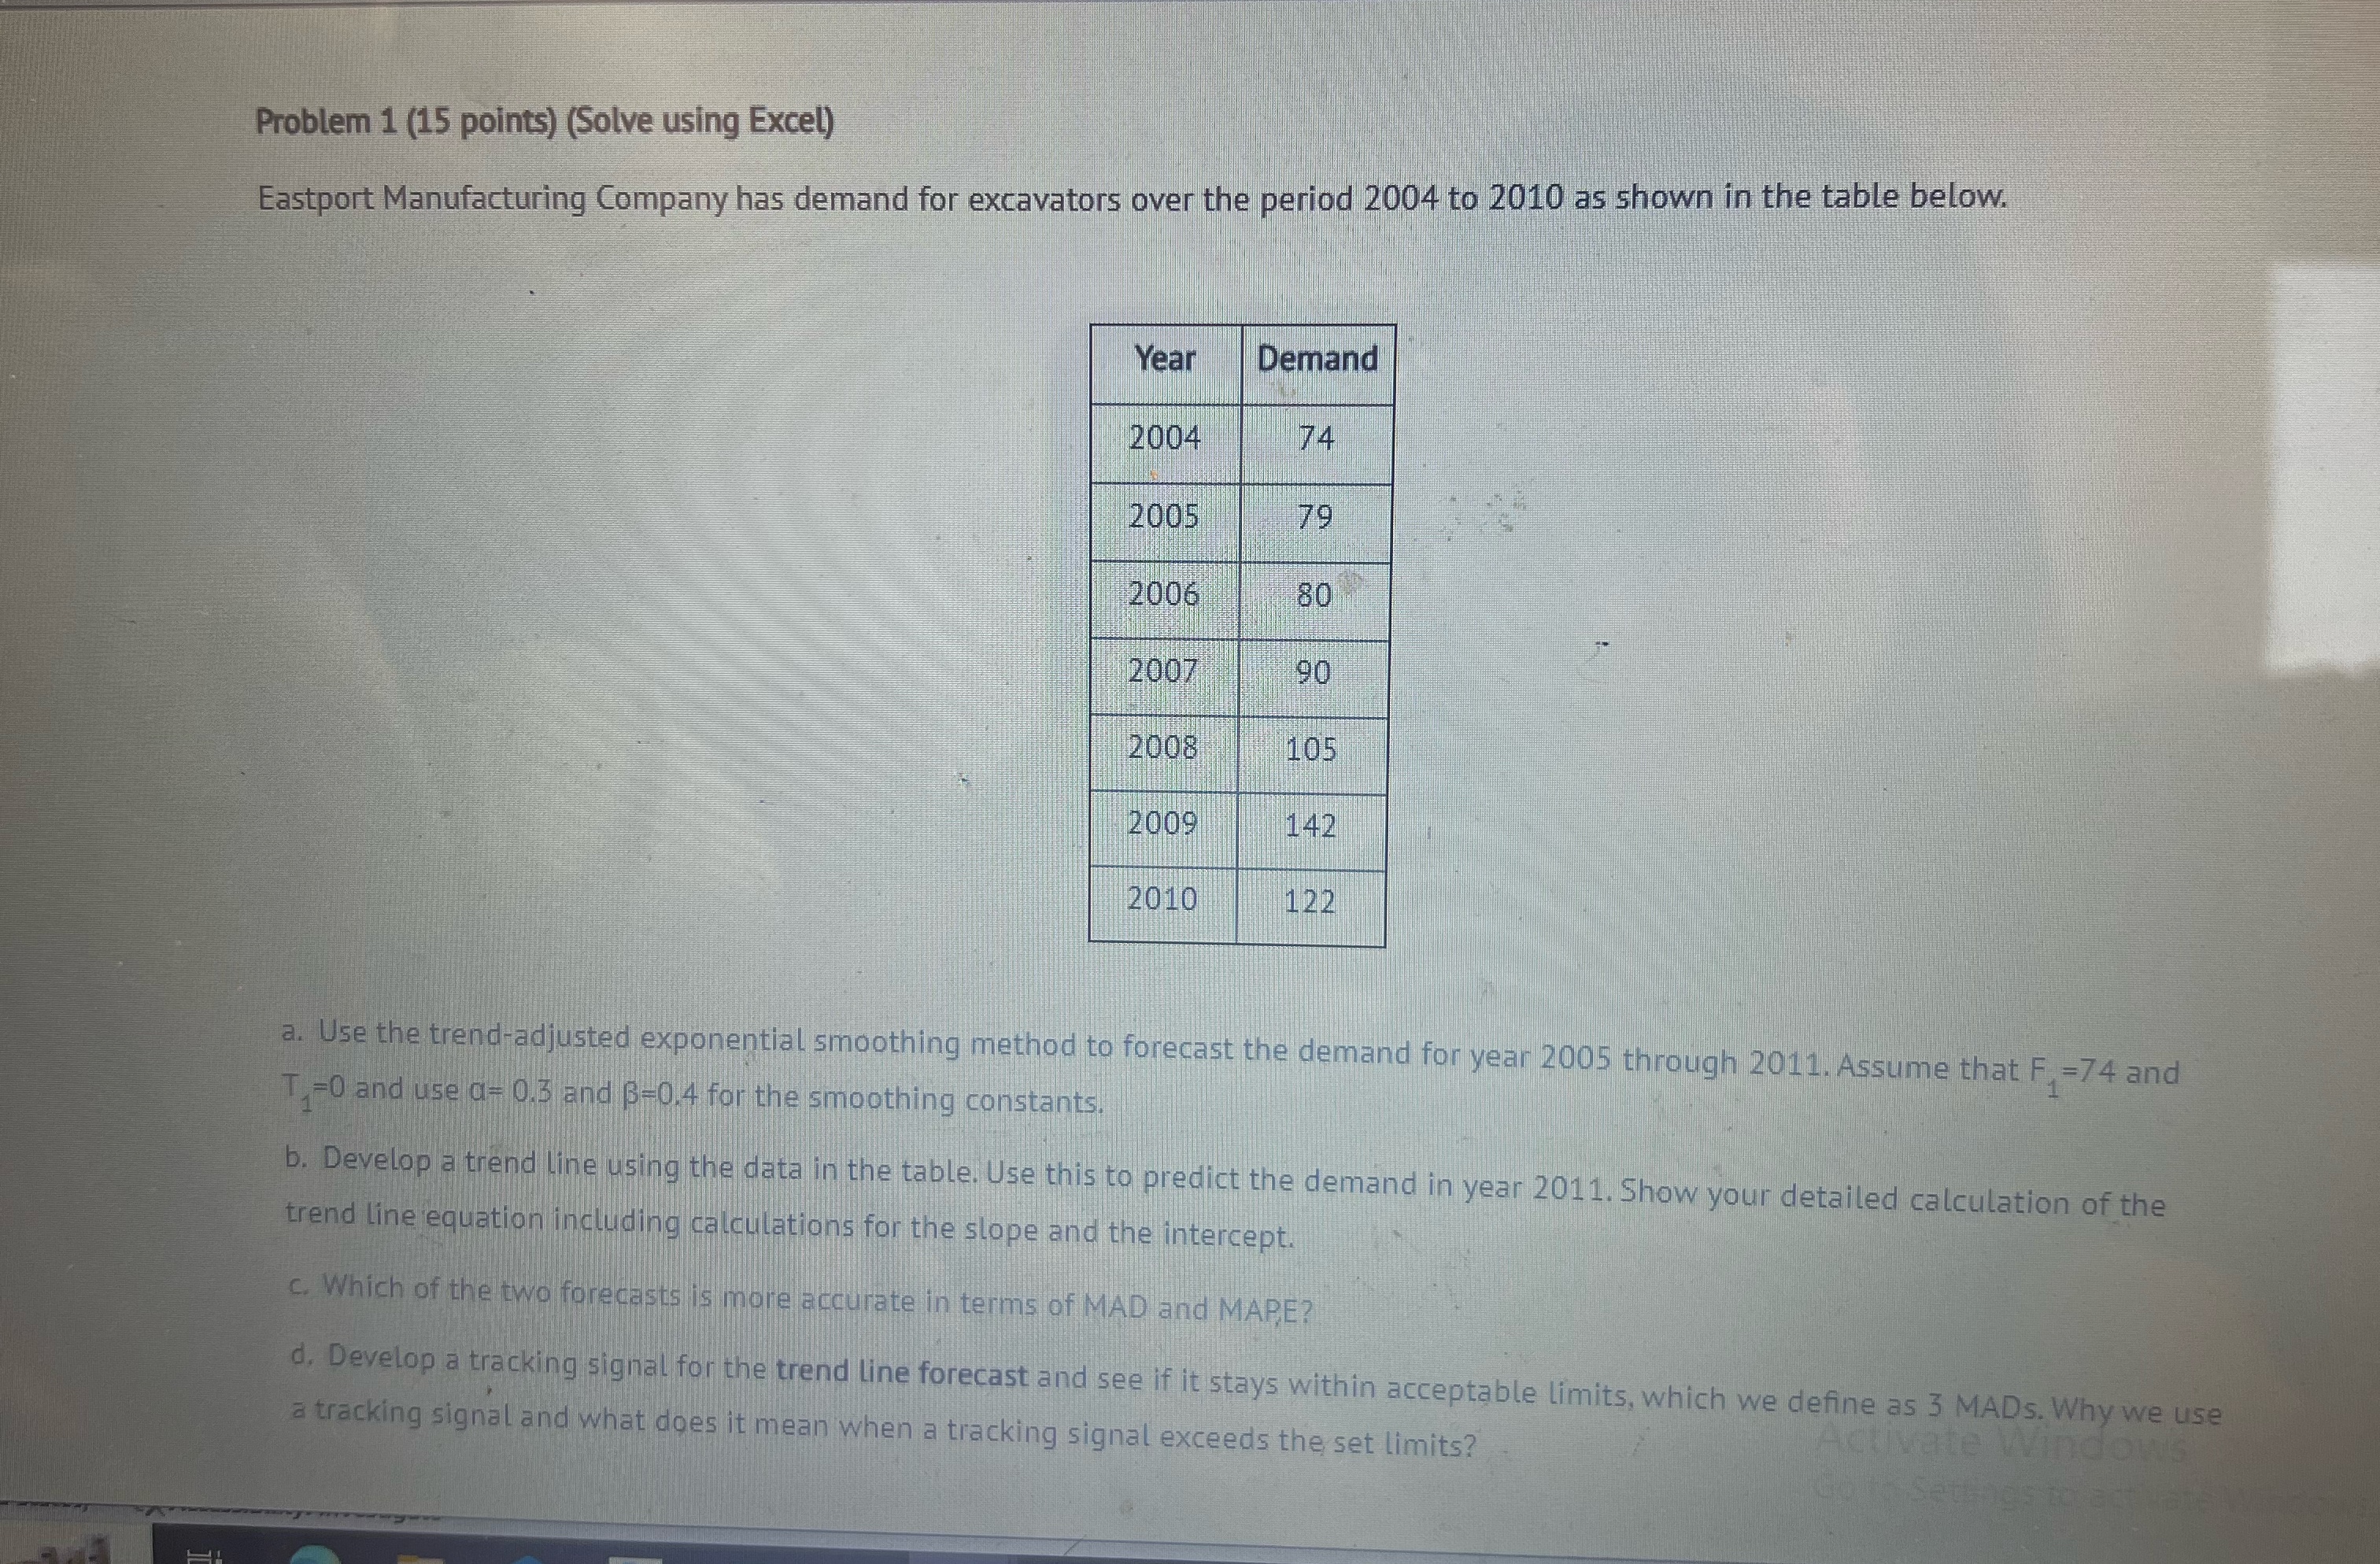
Eastport Manufacturing Company has demand for excavators over the period to as shown in the table below.
tableYearDemand
a Use the trendadjusted exponential smoothing method to forecast the demand for year through Assume that and and use and for the smoothing constants.
b Develop a trend line using the data in the table. Use this to predict the demand in year Show your detailed calculation of the trend line equation including calculations for the slope and the intercept.
c Which of the two forecasts is more accurate in terms of MAD and MAP,E
d Develop a tracking signal for the trend line forecast and see if it stays within acceptable limits which we define as MADs. Why we use a tracking signal and what does it mean when a tracking signal exceeds the set limits
Step by Step Solution
There are 3 Steps involved in it
1 Expert Approved Answer
Step: 1 Unlock

Question Has Been Solved by an Expert!
Get step-by-step solutions from verified subject matter experts
Step: 2 Unlock
Step: 3 Unlock