

Question: Problem 1* 1. What does the command stairs(x, y) do? a. It plots the two given vectors on a normal chart. b. It plots the
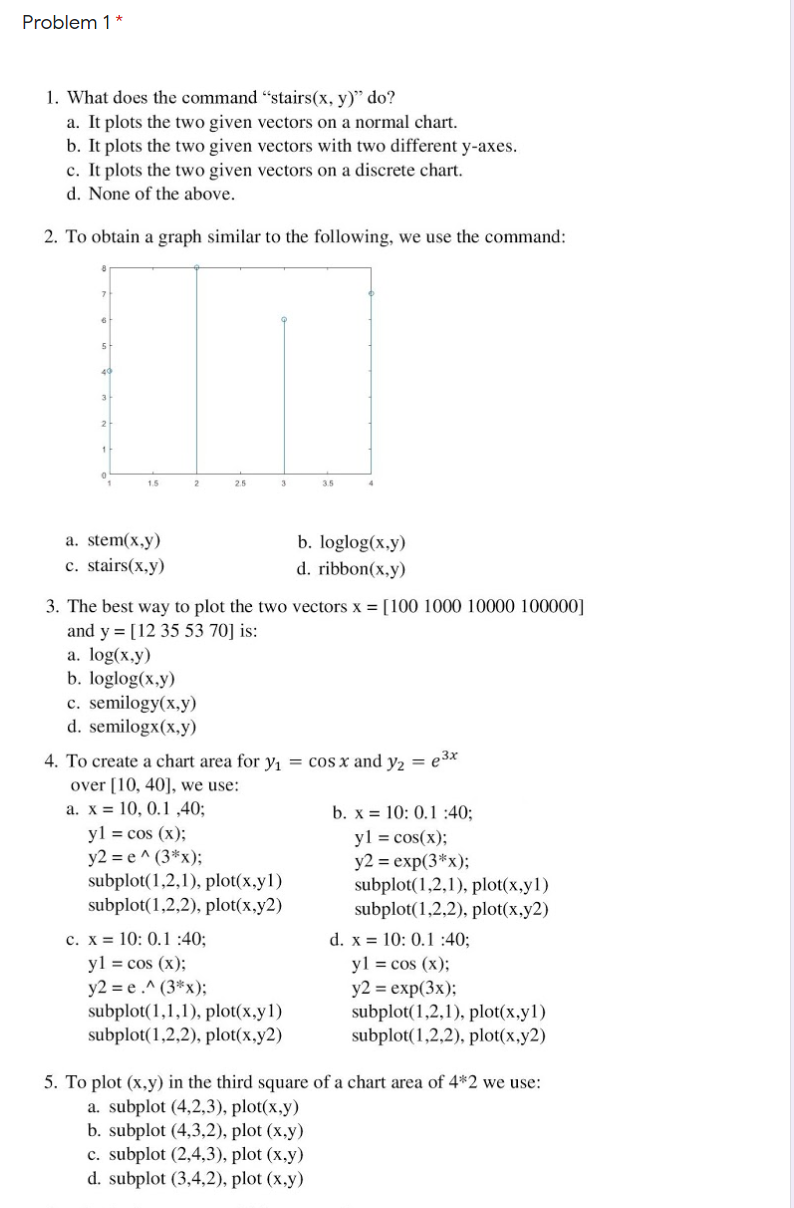
Problem 1* 1. What does the command "stairs(x, y) do? a. It plots the two given vectors on a normal chart. b. It plots the two given vectors with two different y-axes. c. It plots the two given vectors on a discrete chart. d. None of the above. 2. To obtain a graph similar to the following, we use the command: 5 3 15 2.5 3 a. stem(x,y) c. stairs(x,y) b. loglog(x,y) d. ribbon(x,y) 3. The best way to plot the two vectors x = [100 1000 10000 100000] and y = [12 35 53 702 is: a. log(x,y) b. loglog(x,y) c. semilogy(x,y) d. semilogx(x,y) 4. To create a chart area for Y1 = cos x and y2 = e3x over [10, 40), we use: a. x = 10, 0.1,40; b. x = 10:0.1 :40; yl = cos(x); yl = cos(x); y2 = e^(3*x); y2 = exp(3*x); subplot(1,2,1), plot(x,yl) subplot(1,2,1), plot(x,yl) subplot(1,2,2), plot(x,y2) subplot(1,2,2), plot(x,y2) c. X = 10:0.1:40; d. x = 10: 0.1:40; yl = cos(x); yl = cos(x); y2 = e.^(3*); y2 = exp(3x); subplot(1,1,1), plot(x,y1) subplot(1,2,1), plot(x,yl) subplot(1,2,2), plot(x,y2) subplot(1,2,2), plot(x,y2) 5. To plot (x,y) in the third square of a chart area of 4*2 we use: a. subplot (4,2,3), plot(x,y) b. subplot (4,3,2), plot (x,y) c. subplot (2,4,3), plot (x,y) d. subplot (3,4,2), plot (x,y)
Step by Step Solution
There are 3 Steps involved in it

Get step-by-step solutions from verified subject matter experts