

Question: Problem 1 (10 points) For the office layout shown below and the accompanying trip and distance matrices, determine the total distance traveled per day. (5
Problem 1 (10 points)
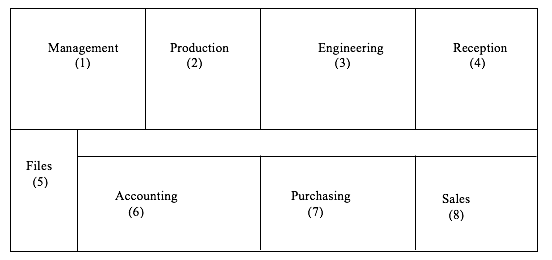
For the office layout shown below and the accompanying trip and distance matrices, determine the total distance traveled per day. (5 points) Find another layout that results in a lower total distance traveled per day. (5 points)
Hint: To redesign the layout, you may want to start with the departments with the most trips per day. To shorten the distance traveled per day, the departments with most trips need to very close to each other. About the distance with redesigned layout, you need to refer to the right numbers. For example, if you decide to switch department 2 and 3, the distance between departments 1 and 2 in the new layout is the same as the distance between department 1 and 3 in previous layout. You can read the example in the textbook for more details. My suggestion is not to switch more than two departments, otherwise your calculation will be unnecessarily difficult.
Accessibility score: Low Click to improve
Interdepartmental Trips per Day
| (2) | (3) | (4) | (5) | (6) | (7) | (8) | |
| (1) | 5 | 4 | 1 | 1 | 6 | 5 | 13 |
| (2) | 12 | 4 | 5 | 2 | 10 | 5 | |
| (3) | 2 | 9 | 2 | 10 | 8 | ||
| (4) | 18 | 12 | 4 | 2 | |||
| (5) | 0 | 0 | 0 | ||||
| (6) | 6 | 14 | |||||
| (7) | 6 |
Distances Between Departments (meters)
| (2) | (3) | (4) | (5) | (6) | (7) | (8) | |
| (1) | 15 | 30 | 45 | 10 | 20 | 35 | 50 |
| (2) | 15 | 30 | 20 | 10 | 20 | 35 | |
| (3) | 15 | 40 | 20 | 10 | 20 | ||
| (4) | 60 | 50 | 30 | 10 | |||
| (5) | 10 | 30 | 50 | ||||
| (6) | 20 | 40 | |||||
| (7) | 20 |
Problem 2 (10 points)
For the office layout shown above, determine the closeness desirability rating using the rating table below. Treat the hallway as if it doesnt exist ( ie, the Production and Accounting Departments touch each other). (5 points) Can you find a more desirable layout? How could you use both the distance traveled and the closeness desirability in assessing the layout alternatives? Can you find a layout resulting in relatively high scores using both types of criteria? (5 points)
Hint: You may want to print out the Closeness Desirability Between Departments table first. Then, you identify all the pairs of neighbors in the layout plan in Problem 1 such as (1, 2), (1, 5), (1, 6),...etc. Then, you circle the number of each pair in the table you printed out and add up all the circle numbers, getting the total score of closeness desirability based on current layout plan. Next, you need to redesign the layout plan based on closeness desirability. You need to put the departments with the highest closeness desirability as close as possible. Then, again you identify all the pairs of neighbors in the new layout plan and recalculate the total score of closeness desirability, which needs to be higher than previous number.
Closeness Desirability Between Departments
| (2) | (3) | (4) | (5) | (6) | (7) | (8) | |
| (1) | 2 | 2 | -1 | 0 | 1 | 3 | 3 |
| (2) | 3 | 0 | 0 | 0 | 3 | 1 | |
| (3) | 0 | 2 | 0 | 2 | 3 | ||
| (4) | 3 | 1 | 2 | 2 | |||
| (5) | 2 | 2 | 1 | ||||
| (6) | 0 | 2 | |||||
| (7) | 1 |
Step by Step Solution
There are 3 Steps involved in it

Get step-by-step solutions from verified subject matter experts