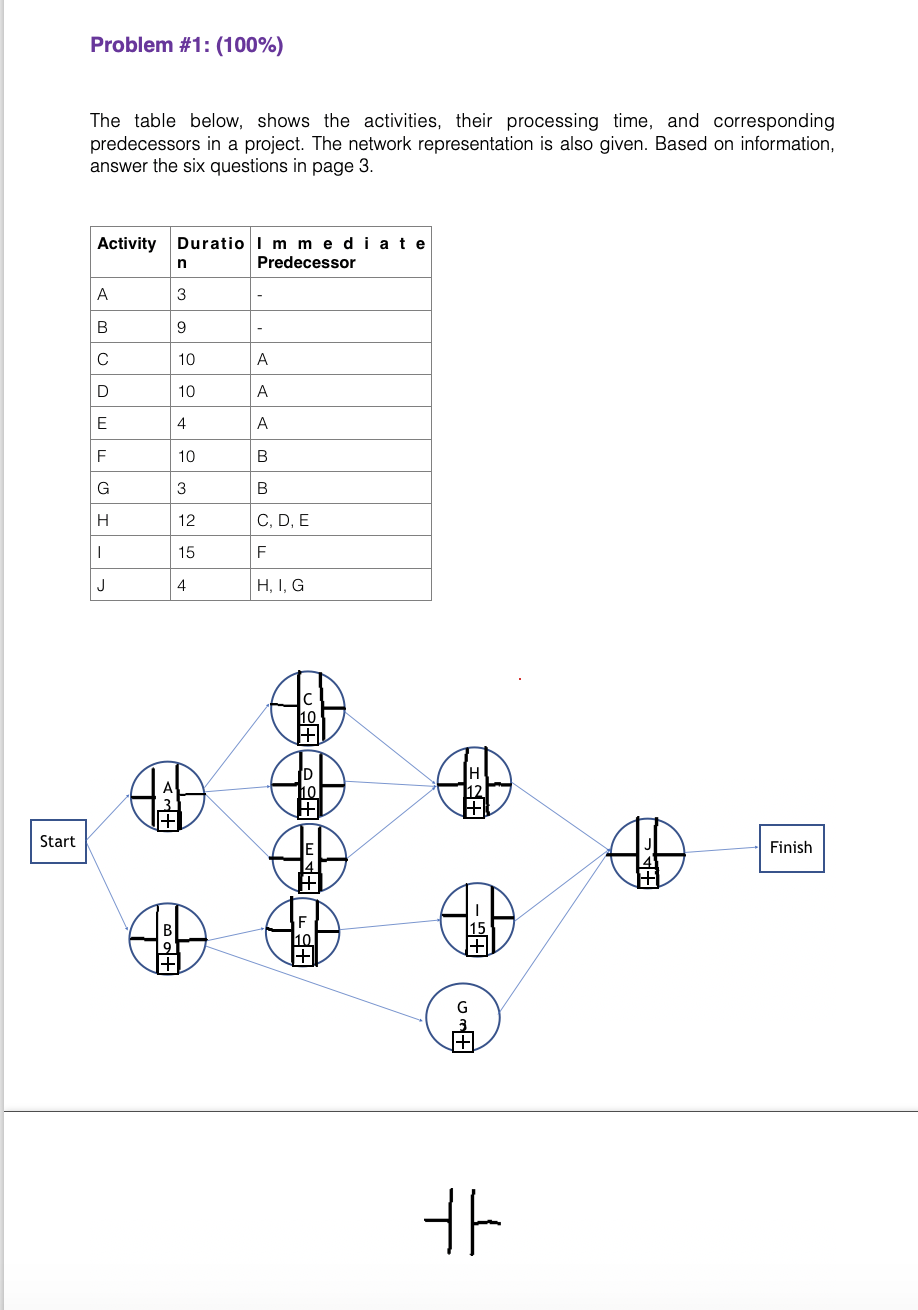
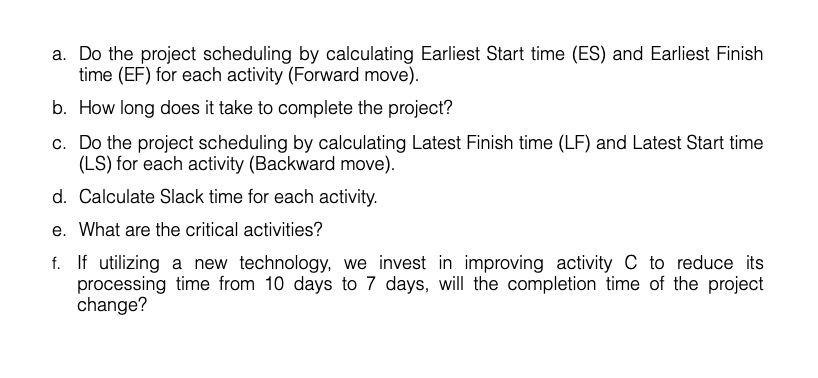
Question: Problem #1: (100%) The table below, shows the activities, their processing time, and corresponding predecessors in a project. The network representation is also given. Based

Problem #1: (100%) The table below, shows theProblem #1: (100%) The table below, shows the

Problem #1: (100%) The table below, shows the activities, their processing time, and corresponding predecessors in a project. The network representation is also given. Based on information, answer the six questions in page 3. Activity Duratio Immediate Predecessor n A 3 B 9 10 A D 10 A E 4 A F 10 B G 3 B H 12 C, D, E 1 15 F J 4 HI, G 10 4 ID 110 + + Start Finish CAD th a. Do the project scheduling by calculating Earliest Start time (ES) and Earliest Finish time (EF) for each activity (Forward move). b. How long does it take to complete the project? c. Do the project scheduling by calculating Latest Finish time (LF) and Latest Start time (LS) for each activity (Backward move). d. Calculate Slack time for each activity. e. What are the critical activities? f. If utilizing a new technology, we_invest in improving activity C to reduce its processing time from 10 days to 7 days, will the completion time of the project change

Step by Step Solution

There are 3 Steps involved in it

1 Expert Approved Answer
Step: 1 Unlock blur-text-image
Question Has Been Solved by an Expert!

Get step-by-step solutions from verified subject matter experts

Step: 2 Unlock
Step: 3 Unlock

Students Have Also Explored These Related General Management Questions!