

Question: Problem 1 (30%) The following data from an oil well drilling and production project is available Drilling, fracking and completion cost.. Estimated oil well recoverable
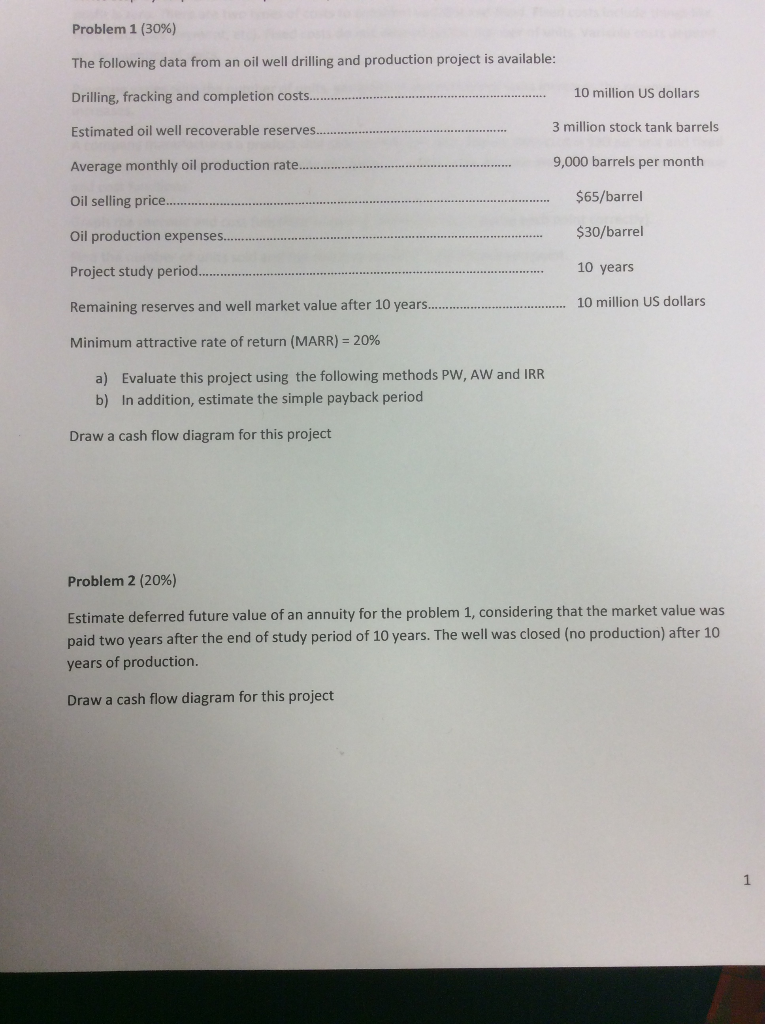
Problem 1 (30%) The following data from an oil well drilling and production project is available Drilling, fracking and completion cost.. Estimated oil well recoverable reserves.. Average monthly oil production rat.e. Oil selling price Oil production expenses Project study period.. Remaining reserves and well market value after 10 years Minimum attractive rate of return (MARR)-20% 10 million US dollars 3 million stock tank barrels 9,000 barrels per month .$65/barrel $30/barrel 10 years . 10 million US dollars Evaluate this project using the following methods PW, AW and IRR In addition, estimate the simple payback period a) b) Draw a cash flow diagram for this project Problem 2 (20%) Estimate deferred future value of an annuity for the problem 1, considering that the market value was paid two years after the end of study period of 10 years. The well was closed (no production) after 10 years of production Draw a cash flow diagram for this project Problem 1 (30%) The following data from an oil well drilling and production project is available Drilling, fracking and completion cost.. Estimated oil well recoverable reserves.. Average monthly oil production rat.e. Oil selling price Oil production expenses Project study period.. Remaining reserves and well market value after 10 years Minimum attractive rate of return (MARR)-20% 10 million US dollars 3 million stock tank barrels 9,000 barrels per month .$65/barrel $30/barrel 10 years . 10 million US dollars Evaluate this project using the following methods PW, AW and IRR In addition, estimate the simple payback period a) b) Draw a cash flow diagram for this project Problem 2 (20%) Estimate deferred future value of an annuity for the problem 1, considering that the market value was paid two years after the end of study period of 10 years. The well was closed (no production) after 10 years of production Draw a cash flow diagram for this project
Step by Step Solution
There are 3 Steps involved in it

Get step-by-step solutions from verified subject matter experts