Question: Problem 1 [50 points) Recall your experience with the NSU canteen. You should have observed many processes that the canteen staff performs when serving you.
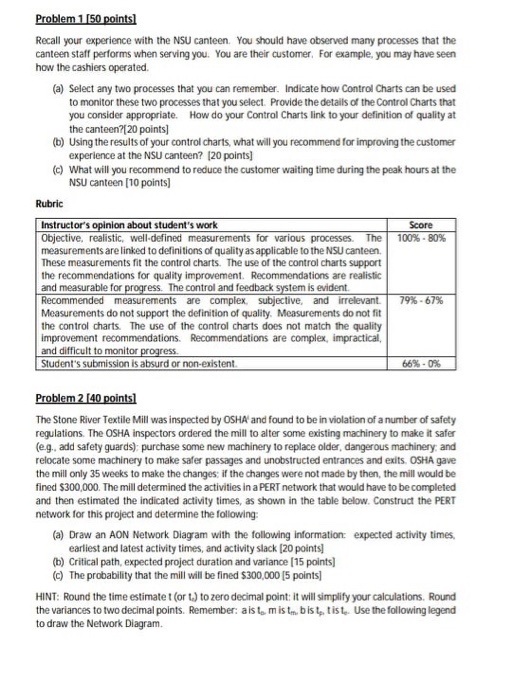
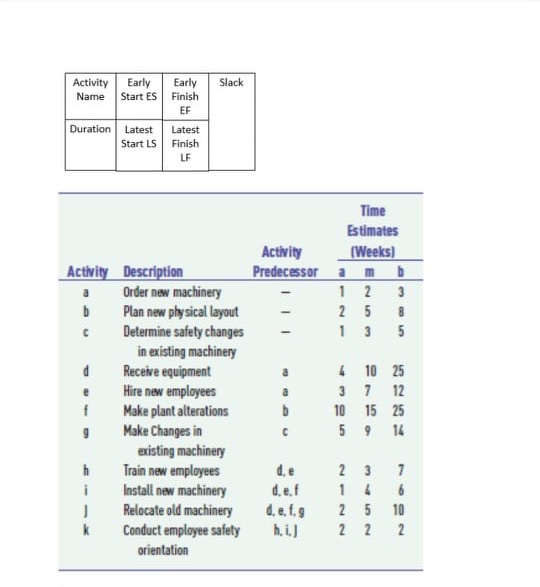
Problem 1 [50 points) Recall your experience with the NSU canteen. You should have observed many processes that the canteen staff performs when serving you. You are their customer. For example, you may have seen how the cashiers operated (a) Select any two processes that you can remember. Indicate how Control Charts can be used to monitor these two processes that you select. Provide the details of the Control Charts that you consider appropriate. How do your Control Charts link to your definition of quality at the canteen?(20 points) (b) Using the results of your control charts, what will you recommend for improving the customer experience at the NSU canteen? (20 points) (c) What will you recommend to reduce the customer waiting time during the peak hours at the NSU canteen (10 points) Rubric Instructor's opinion about student's work Score Objective, realistic, well-defined measurements for various processes. The 100% - 80% measurements are linked to definitions of quality as applicable to the NSU canteen, These measurements fit the control charts. The use of the control charts support the recommendations for quality improvement. Recommendations are realistic and measurable for progress. The control and feedback system is evident. Recommended measurements are complex, subjective and irrelevant. 79% -67% Measurements do not support the definition of quality. Measurements do not fit the control charts. The use of the control charts does not match the quality improvement recommendations. Recommendations are complex, impractical and difficult to monitor progress. Student's submission is absurd or non-existent. 66% -0% Problem 2 [40 points) The Stone River Textile Mill was inspected by OSHA and found to be in violation of a number of safety regulations. The OSHA inspectors ordered the mill to alter some existing machinery to make it safer (e.g., add safety guards), purchase some new machinery to replace older, dangerous machinery, and relocate some machinery to make safer passages and unobstructed entrances and exits. OSHA gave the mill only 35 weeks to make the changes: if the changes were not made by then, the mill would be fined $300,000. The mill determined the activities in a PERT network that would have to be completed and then estimated the indicated activity times, as shown in the table below. Construct the PERT network for this project and determine the following: (a) Draw an AON Network Diagram with the following information: expected activity times, earliest and latest activity times, and activity slack (20 points) (b) Critical path, expected project duration and variance (15 points) (C) The probability that the mill will be fined $300,000 (5 points] HINT: Round the time estimatet (or t.) to zero decimal point: it will simplify your calculations. Round the variances to two decimal points. Remember: aist, mis tm, bist, tist. Use the following legend to draw the Network Diagram. Slack Activity Early Early Name Start ES Finish EF Duration Latest Latest Start LS Finish LF Time Estimates Activity (Weeks) Predecessor amb 1 2 3 2 5 8 13 5 D Activity Description Order new machinery Plan new plysical layout Determine safety changes in existing machinery Receive equipment Hire new employees Make plant alterations 9 Make Changes in existing machinery h Train new employees Install new machinery Relocate old machinery k Conduct employee safety orientation 4 10 25 3 7 12 10 15 25 5914 i d.e.f d. e. f. 9 hi) 23 7 6 2 5 10 2 2 2