

Question: Problem 1 (6 points): Assume that the graph above shows a sound wave. Label the x and y axes. What do they represent? Add numbers
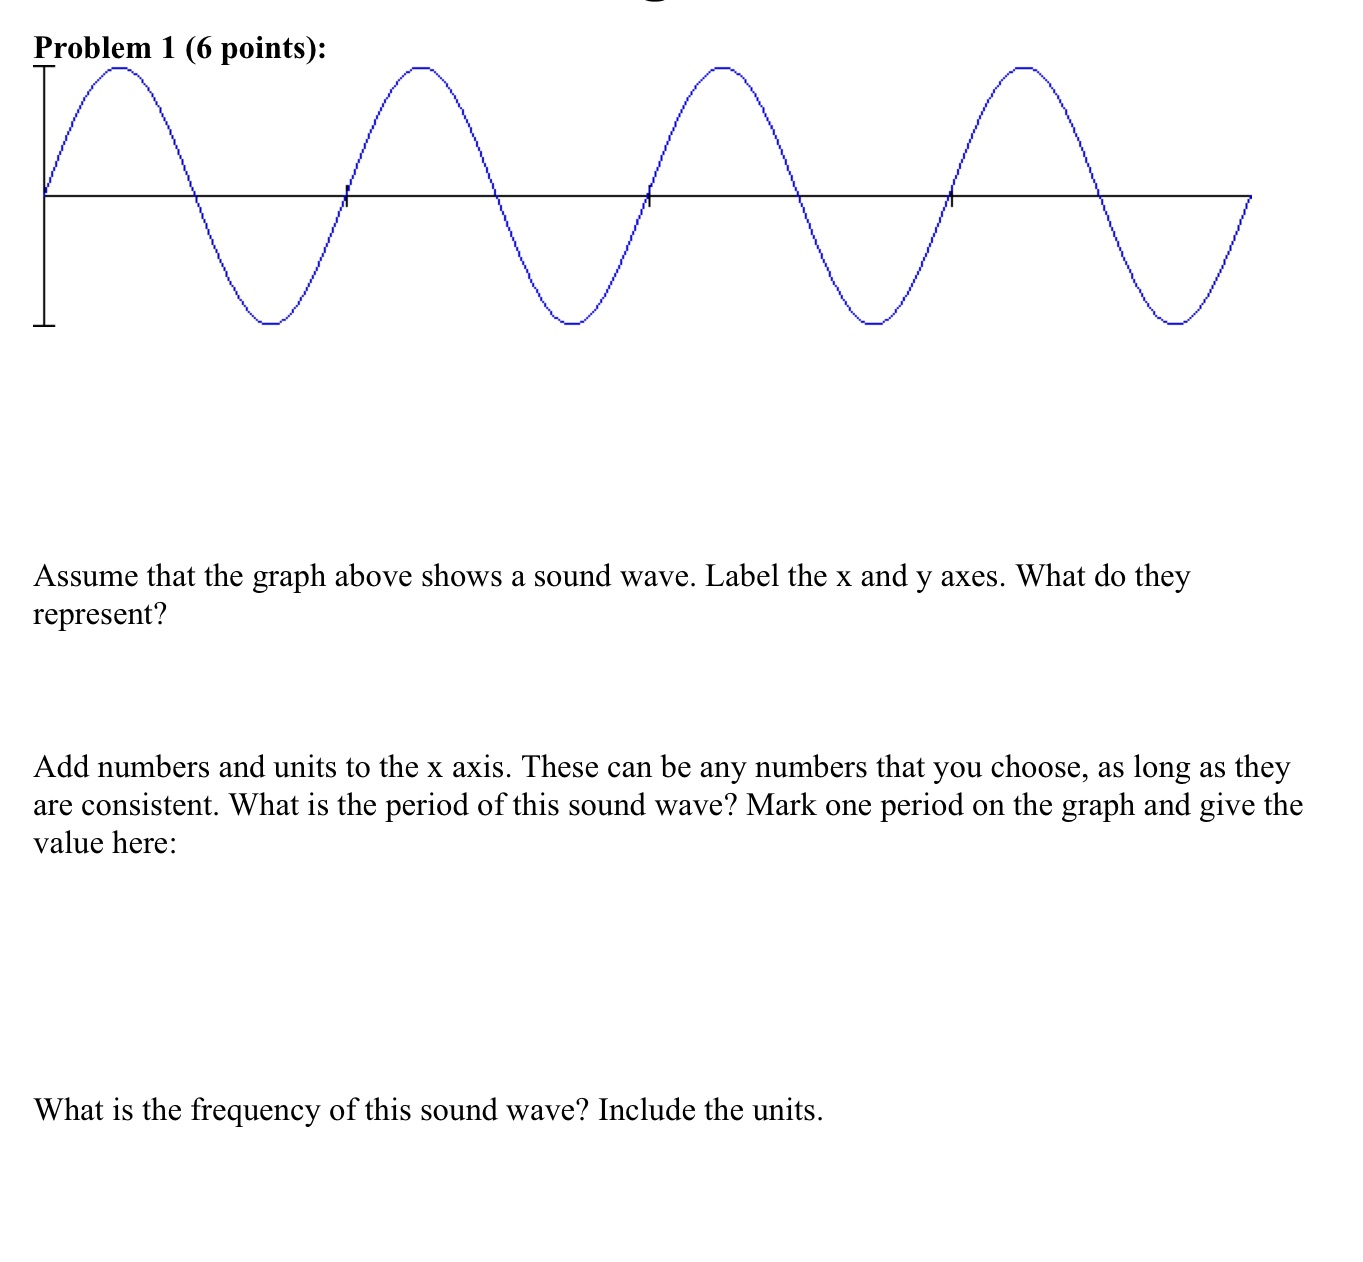
Problem 1 (6 points): Assume that the graph above shows a sound wave. Label the x and y axes. What do they represent? Add numbers and units to the X axis. These can be any numbers that you choose, as long as they are consistent. What is the period of this sound wave? Mark one period on the graph and give the value here: What is the frequency of this sound wave? Include the units
Step by Step Solution
There are 3 Steps involved in it
1 Expert Approved Answer
Step: 1 Unlock

Question Has Been Solved by an Expert!
Get step-by-step solutions from verified subject matter experts
Step: 2 Unlock
Step: 3 Unlock