

Question: Problem 1. {9 points} The following figure gives an input to the maximum flow problem, with source node 1, and sink node 6. A feasible
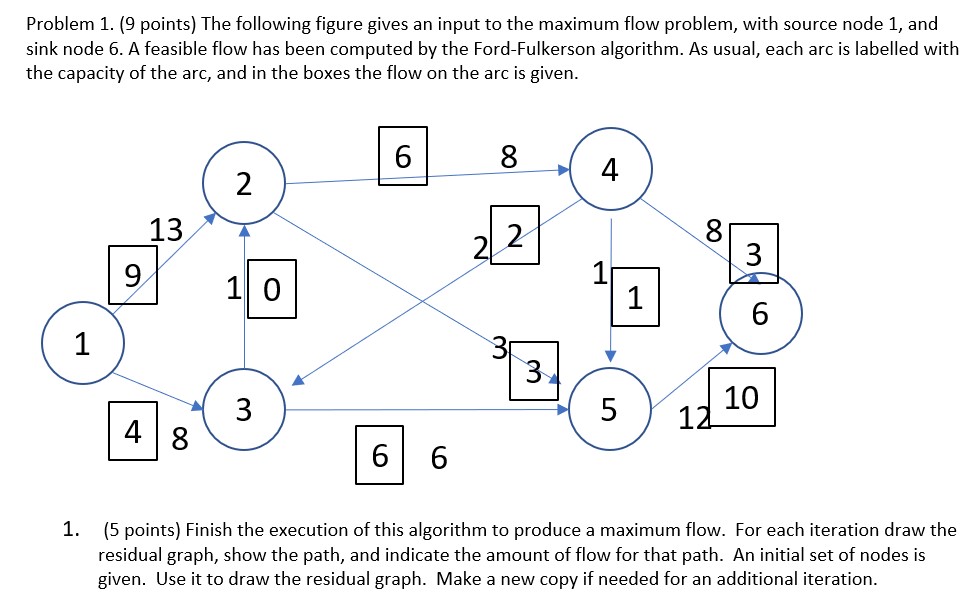
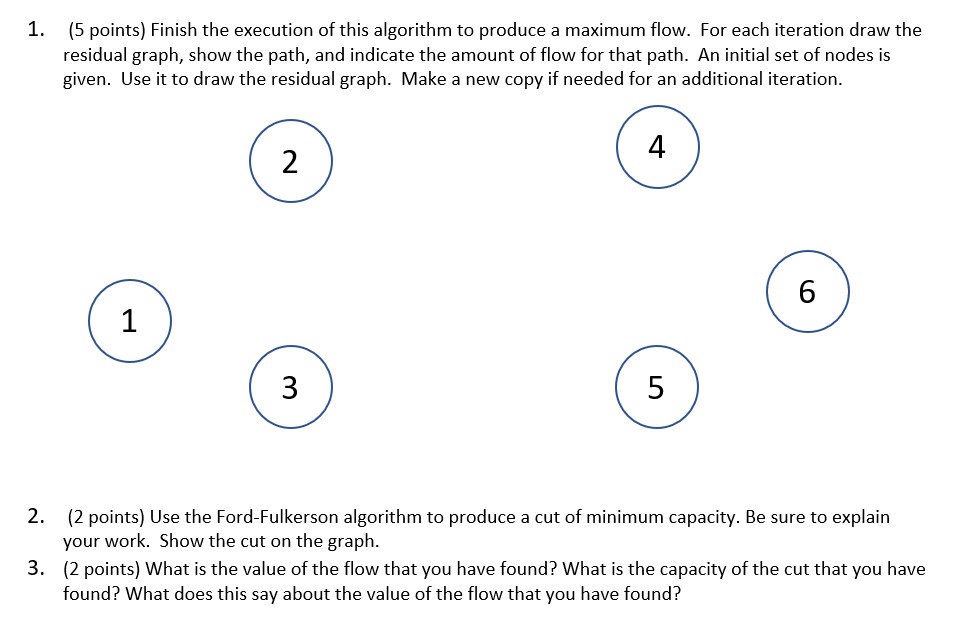
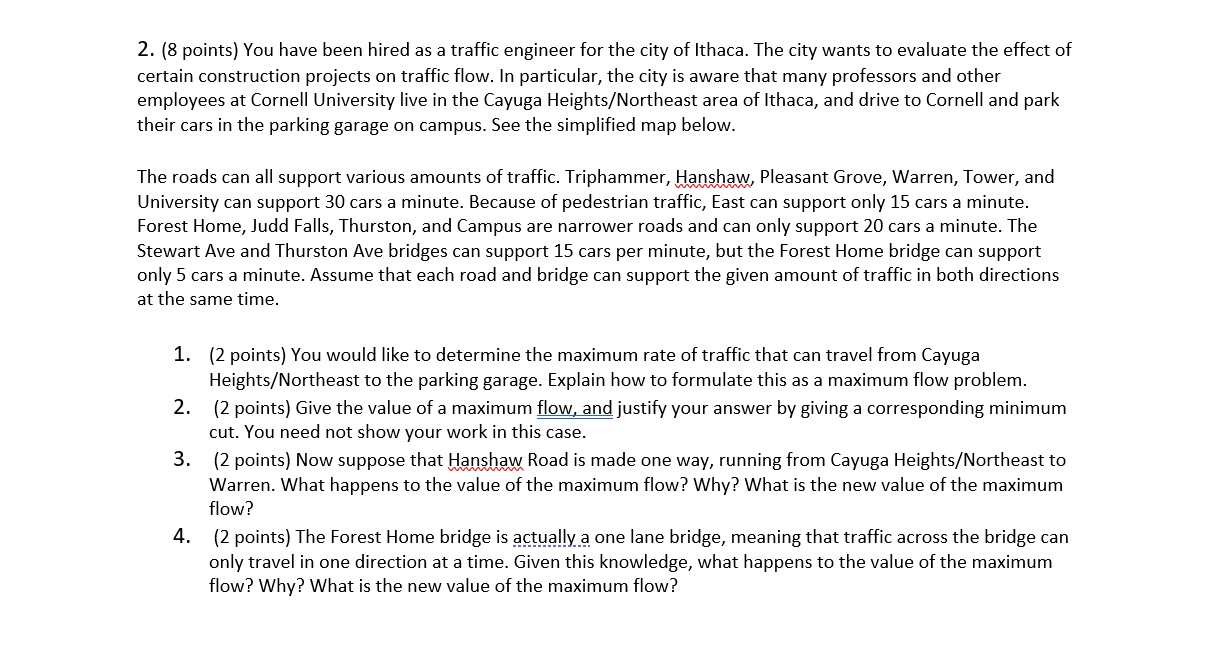
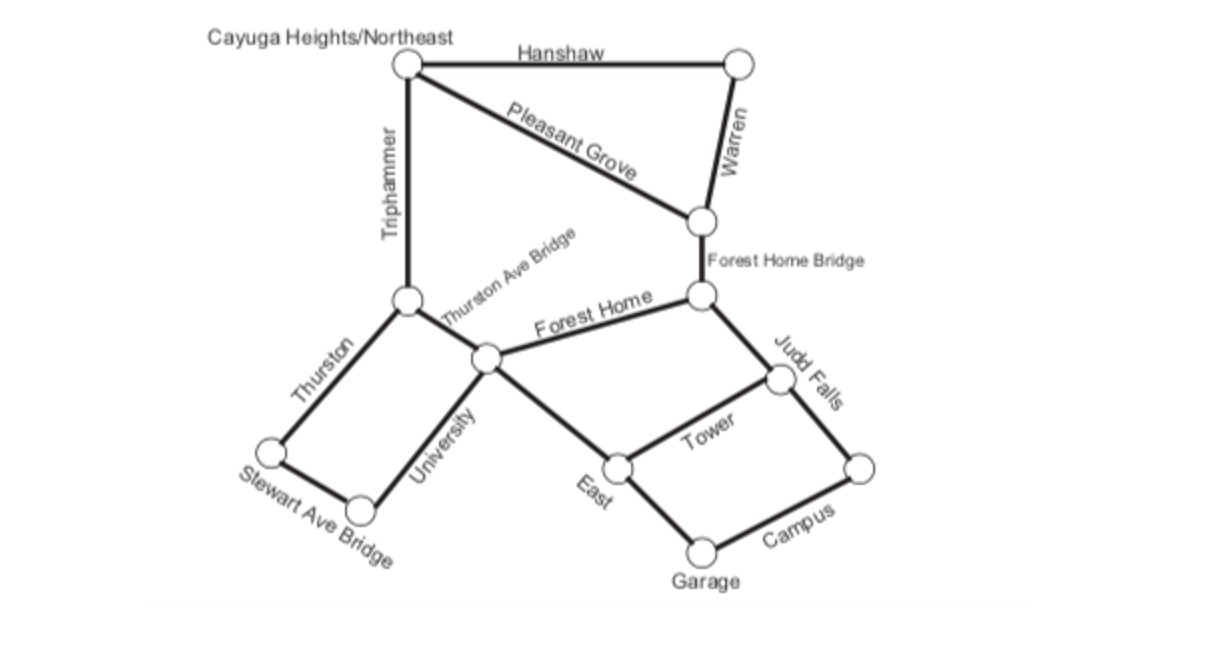
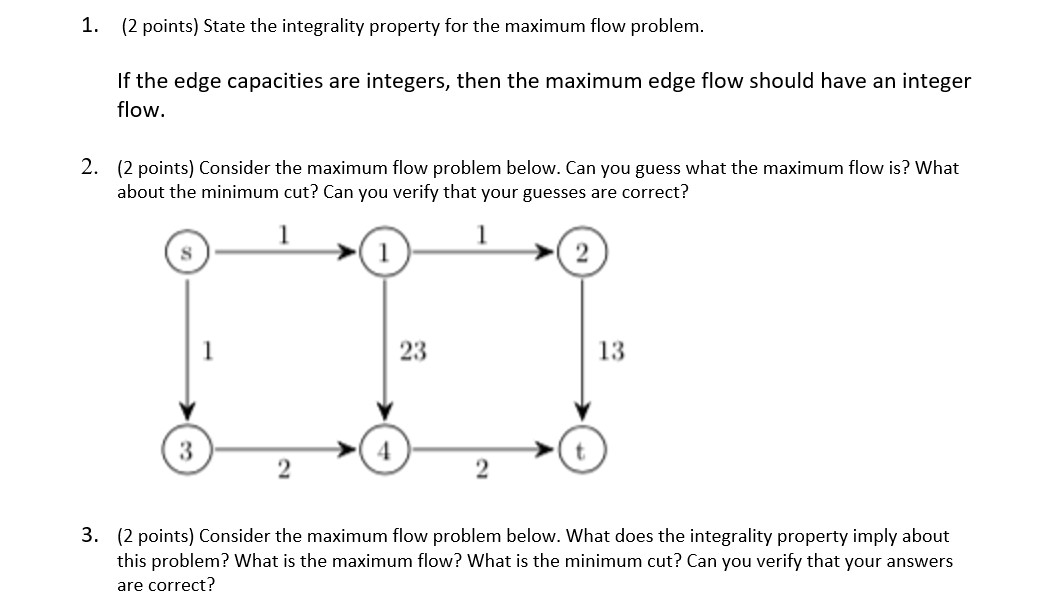
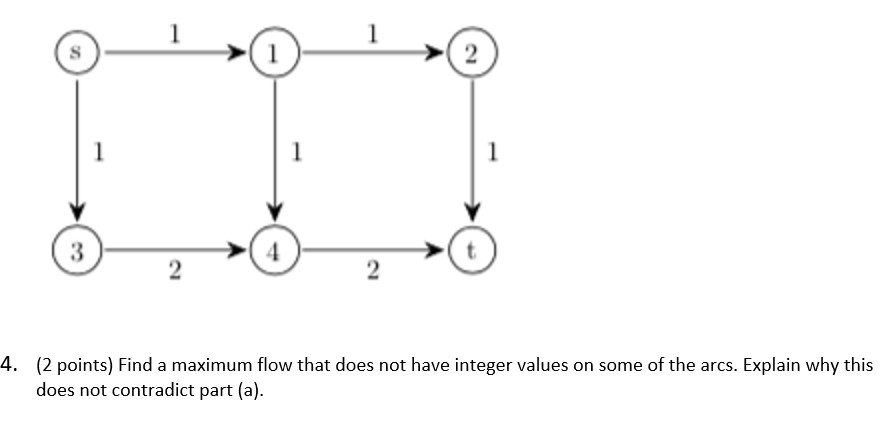
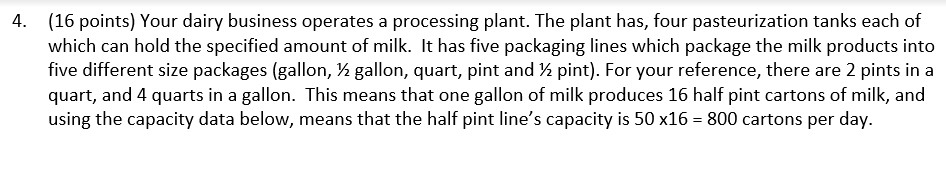
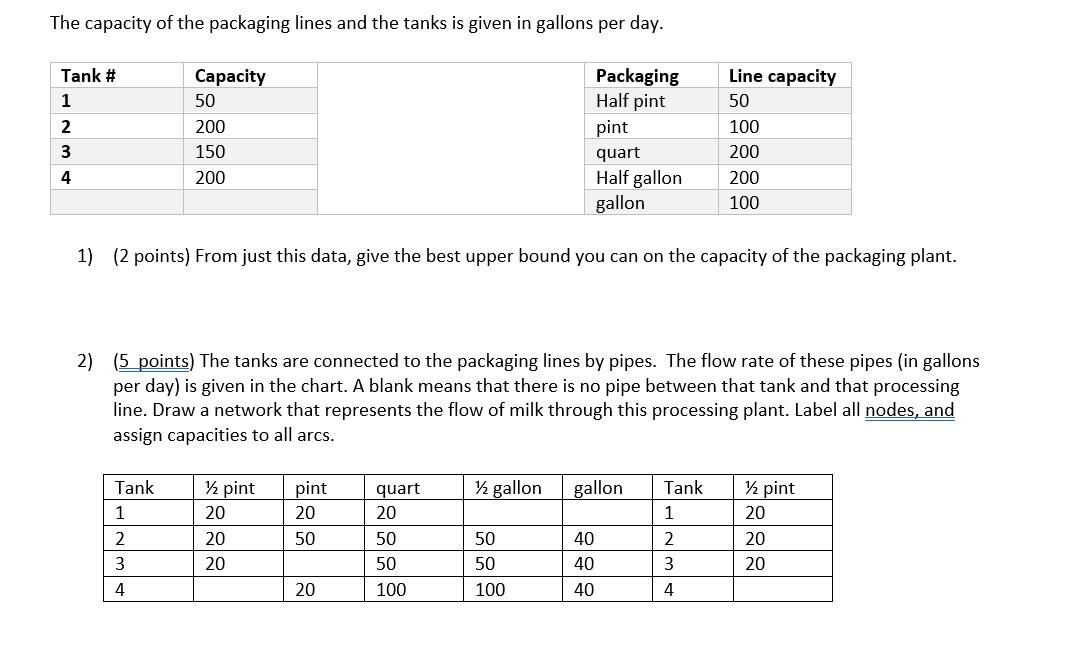
Problem 1. {9 points} The following figure gives an input to the maximum flow problem, with source node 1, and sink node 6. A feasible flow has been computed by the FordFulkerson algorithm. As usual, each arc is labelled with the capacity of the arc, and in the boxes the flow on the arc is given. E8 E6 1. {5 points) Finish the execution of this algorithm to produce a maximum flow. For each iteration draw the residual graph, show the path, and indicate the amount of flow for that path. An initial set of nodes is given. Use it to draw the residual graph. Make a new copy if needed for an additional iteration. 1. {5 points} Finish the execution of this algorithm to produce a maximum flow. For each iteration draw the residual graph, show the path, and indicate the amount of flow for that path. An initial set of nodes is given. Use it to draw the residual graph. Make a new copy if needed for an additional iteration. 2. [2 points) Use the FordFulkerson algorithm to produce a cut of minimum capacity. Be sure to explain your work. Show the cut on the graph. 3. (2 points) What is the value of the flow that you have found? What is the capacity of the cut that you have found? What does this say about the value of the flow that you have found? 2. {8 points]I You have been hired as a traffic engineer for the city of Ithaca. The city wants to evaluate the effect of certain construction projects on trafc flow. In particular, the city is aware that many professors and other employees at Cornell University live in the Cayuga Heightstortheast area of Ithaca, and drive to Cornell and park their cars in the parking garage on campus. See the simplified map below. The roads can all support various amounts of traffic. Triphammer, Hanshaw, Pleasant Grove, Warren, Tower, and University can support 30 cars a minute. Because of pedestrian traffic, East can support only 15 cars a minute. Forest Home, Judd Falls, Thurston, and Campus are narrower roads and can only support 20 cars a minute. The Stewart Ave and Thurston Ave bridges can support 15 cars per minute, but the Forest Home bridge can support only 5 cars a minute. Assume that each road and bridge can support the given amount of traffic in both directions at the same time. 1. (2 points) You would like to determine the maximum rate of trafc that can travel from Cayuga Heights/Northeast to the parking garage. Explain how to formulate this as a maximum flow problem. 2. [2 points) Give the value of a maximum ow and justify your answer by giving a corresponding minimum cut. You need not Show your work in this case. 3. [2 points} Now suppose that Hanshaw Road is made one way, running from Cayuga Heights/Northeast to Warren. What happens to the value of the maximum flow? Why? What is the new value of the maximum flow? 4. [2 points} The Forest Home bridge is ggtygllyg one lane bridge, meaning that trafc across the bridge can only travel in one direction at a time. Given this knowledge, what happens to the value of the maximum flow? Why? What is the new value of the maximum flow? Cayuga Heights/Northeast Hanshaw Pleasant Grove Warren Triphammer Forest Home Bridge Thurston Ave Bridge Forest Home Thurston Judd Falls Tower University East Stewart Ave Bridge Campus Garage1. (2 points) State the integrality property for the maximum flow problem. If the edge capacities are integers, then the maximum edge flow should have an integer flow. 2. (2 points) Consider the maximum flow problem below. Can you guess what the maximum flow is? What about the minimum cut? Can you verify that your guesses are correct? 1 i T 1 i 2'@2' 3. (2 points) Consider the maximum flow problem below. What does the integrality property imply about this problem? What is the maximum flow? What is the minimum cut? Can you verify that your answers are correct? 1T1? 2'@2* 4. (2 points) Find a maximum flow that does not have integer values on some of the arcs. Explain why:r this does not contradict part (a). (16 points} Your dairy business operates a processing plant. The plant has, four pasteurization tanks each of which can hold the specified amount of milk. It has five packaging lines which package the milk products into five different size packages (gallon, H gallon, quart, pint and 1/3 pint). For your reference, there are 2 pints in a quart, and 4 quarts in a gallon. This means that one gallon of milk produces 16 half pint cartons of milk, and using the capacity data below, means that the half pint line's capacity is 50 x16 = 800 cartons per day. The capacity of the packaging lines and the tanks is given in gallons per day. Tank it Capacity Packaging Line capacity 1 50 Half pint 50 2 200 _pint 100 _ 3 150 _ quart 200 4 200 Half gallon 200 gallon 100 1) (2 points) From just this data, give the best upper bound you can on the capacity of the packaging plant. 2) (5 points) The tanks are connected to the packaging lines by pipes. The flow rate of these pipes l{in gallons per day) is given in the chart. A blank means that there is no pipe between that tank and that processing line. Draw a network that represents the flow of milk through this processing plant. Label all nodes. and assign capacities to all arcs. Tank FE pint pint quart 14 gallon gallon Tank FE pint 1 20 20 20 1 20 2 20 50 50 50 40 2 20 3 20 50 50 40 3 20 4 20 100 100 40 4 3) [2 points} Today your trucks have delivered 625 gallons of milk to the plant. Is it possible to process allugf this milk today? 4) (5 points) Give a production plan for processing as much of the milk as possible. 5] (2 points) The 1'3 pints of milk are delivered only to a local school. The delivery truck that picks them up has a capacity of 480 cartons. You cannot store packaged milk at your facility. Update your graph to reect this new constraint
Step by Step Solution
There are 3 Steps involved in it

Get step-by-step solutions from verified subject matter experts