

Question: Problem # 1 : A sieve analysis test performed on an aggregate and the results are as shown in table shown below. Draw grain size
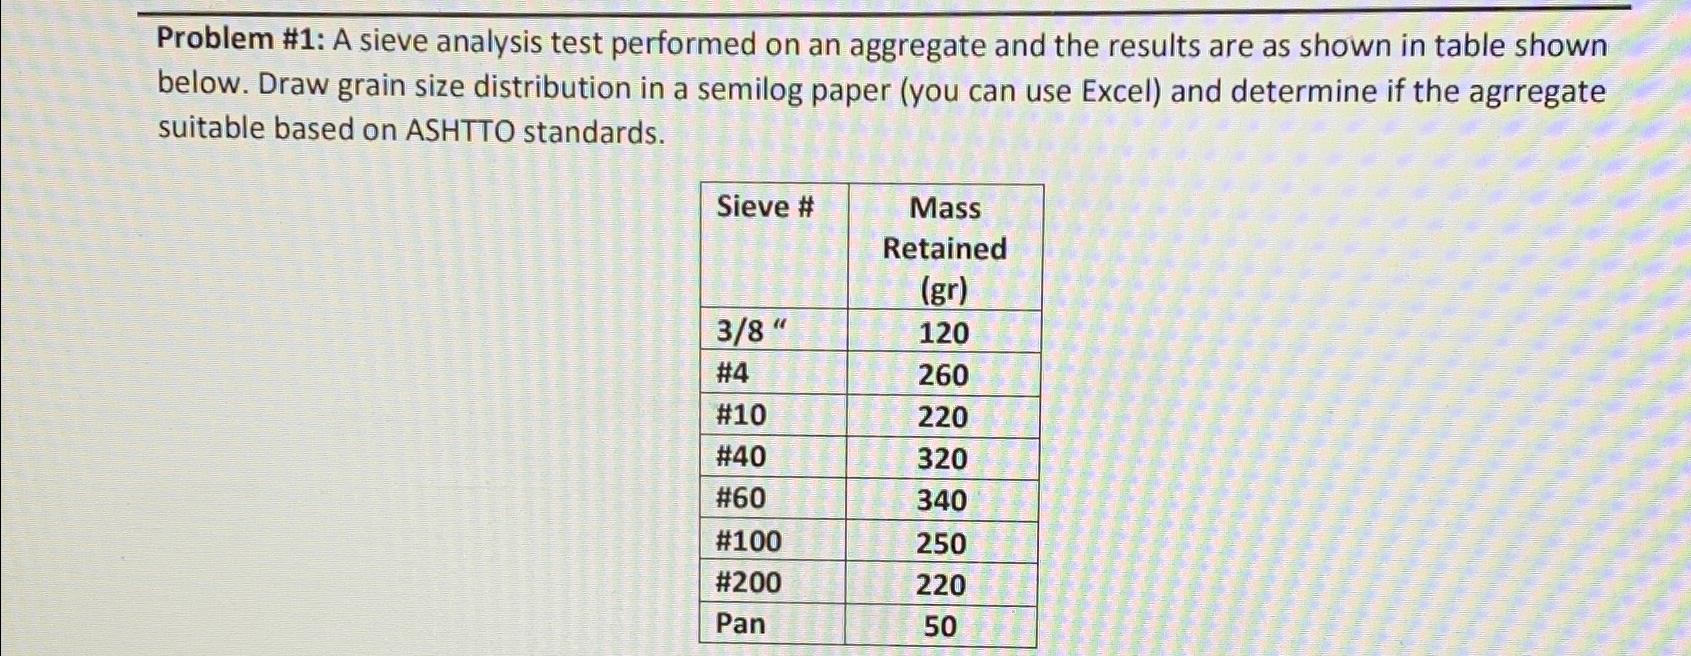
Problem #: A sieve analysis test performed on an aggregate and the results are as shown in table shown below. Draw grain size distribution in a semilog paper you can use Excel and determine if the agrregate suitable based on ASHTTO standards.
tableSieve #tableMassRetained
Step by Step Solution
There are 3 Steps involved in it
1 Expert Approved Answer
Step: 1 Unlock

To solve the problem well follow these steps Step 1 Organize the Data The given data is Sieve Mass R... View full answer
Question Has Been Solved by an Expert!
Get step-by-step solutions from verified subject matter experts
Step: 2 Unlock
Step: 3 Unlock