

Question: Problem 1: Accounting for Differences in Hours Worked [40 marks] Consider the following data on hours worked across countries for the period 1993-96: Table 1:
![Problem 1: Accounting for Differences in Hours Worked [40 marks] Consider](https://dsd5zvtm8ll6.cloudfront.net/si.experts.images/questions/2024/10/66fbdb7a12262_75366fbdb79811e2.jpg)
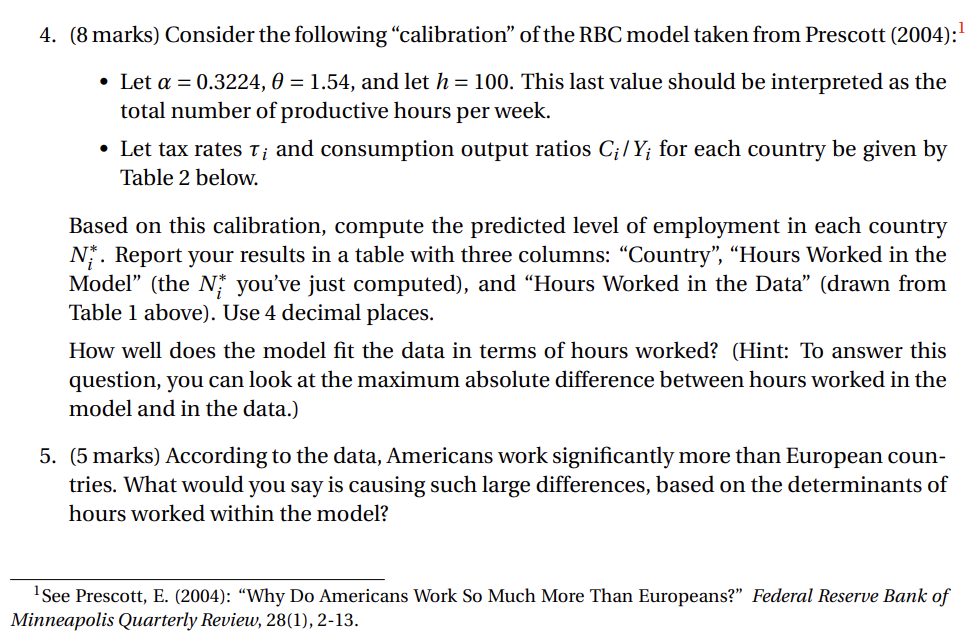
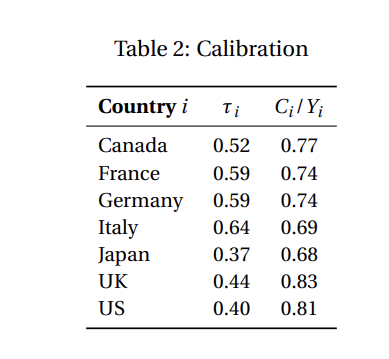
Problem 1: Accounting for Differences in Hours Worked [40 marks] Consider the following data on hours worked across countries for the period 1993-96: Table 1: Data *Per person aged 15-64. This problem aims at rationalising these cross-country differences through the lens of the RBC model studied in class. 4. (8 marks) Consider the following "calibration" of the RBC model taken from Prescott (2004): - Let =0.3224,=1.54, and let h=100. This last value should be interpreted as the total number of productive hours per week. - Let tax rates i and consumption output ratios Ci/Yi for each country be given by Table 2 below. Based on this calibration, compute the predicted level of employment in each country Ni. Report your results in a table with three columns: "Country", "Hours Worked in the Model" (the Ni you've just computed), and "Hours Worked in the Data" (drawn from Table 1 above). Use 4 decimal places. How well does the model fit the data in terms of hours worked? (Hint: To answer this question, you can look at the maximum absolute difference between hours worked in the model and in the data.) 5. (5 marks) According to the data, Americans work significantly more than European countries. What would you say is causing such large differences, based on the determinants of hours worked within the model? 1 See Prescott, E. (2004): Why Do Americans Work So Much More Than Europeans?" Federal Reserve Bank of Minneapolis Quarterly Review, 28(1), 2-13. Table 2: Calibration Problem 1: Accounting for Differences in Hours Worked [40 marks] Consider the following data on hours worked across countries for the period 1993-96: Table 1: Data *Per person aged 15-64. This problem aims at rationalising these cross-country differences through the lens of the RBC model studied in class. 4. (8 marks) Consider the following "calibration" of the RBC model taken from Prescott (2004): - Let =0.3224,=1.54, and let h=100. This last value should be interpreted as the total number of productive hours per week. - Let tax rates i and consumption output ratios Ci/Yi for each country be given by Table 2 below. Based on this calibration, compute the predicted level of employment in each country Ni. Report your results in a table with three columns: "Country", "Hours Worked in the Model" (the Ni you've just computed), and "Hours Worked in the Data" (drawn from Table 1 above). Use 4 decimal places. How well does the model fit the data in terms of hours worked? (Hint: To answer this question, you can look at the maximum absolute difference between hours worked in the model and in the data.) 5. (5 marks) According to the data, Americans work significantly more than European countries. What would you say is causing such large differences, based on the determinants of hours worked within the model? 1 See Prescott, E. (2004): Why Do Americans Work So Much More Than Europeans?" Federal Reserve Bank of Minneapolis Quarterly Review, 28(1), 2-13. Table 2: Calibration
Step by Step Solution
There are 3 Steps involved in it

Get step-by-step solutions from verified subject matter experts