

Question: Problem #1 alculating Expected Returns and Standard Deviations: Discrete Probabilities INPUTS: Expected Return Standard Deviation A4 Product of Probability ofMarket Rate of Probability andDeviation from
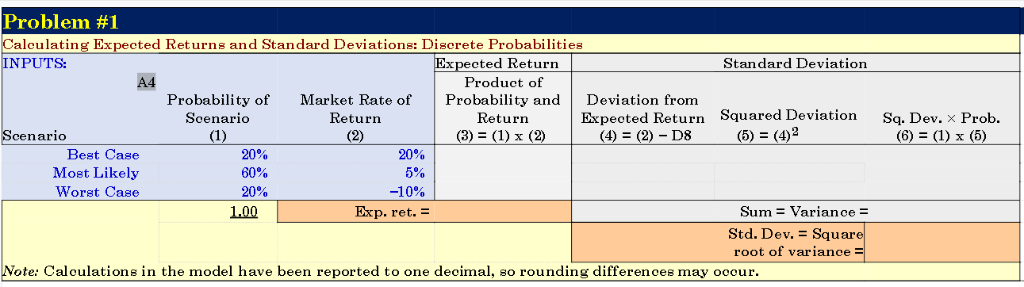
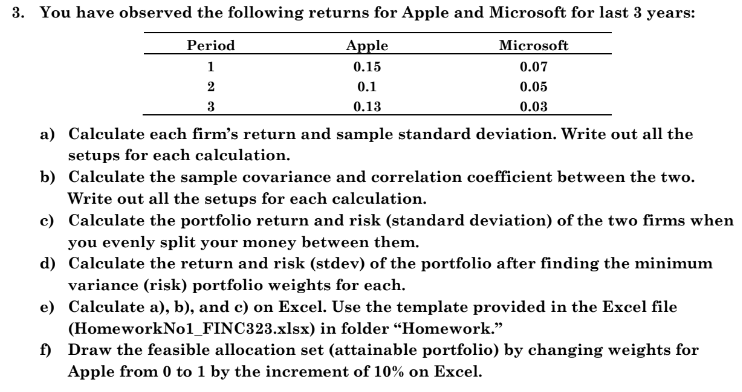
Problem #1 alculating Expected Returns and Standard Deviations: Discrete Probabilities INPUTS: Expected Return Standard Deviation A4 Product of Probability ofMarket Rate of Probability andDeviation from Scenario Return Return Expeoted Return Squared Deviation Sq. Dev. x Prob. Scenarico (4) (2)-D8 Best Case Most Likely Worst Case 20% 60% 20% 20% -1 0% 00 Exp. ret. Sum Variance Std. Dev. Squar root of variance Note: Calculations in the model have been reported to one decimal, so rounding differences may oocur 3. You have observed the following returns for Apple and Microsoft for last 3 years: Apple 0.15 0.1 0.13 Period Microsoft 0.07 0.05 0.03 a) Calculate each firm's return and sample standard deviation. Write out all the setups for each calculation. b) Calculate the sample covariance and correlation coefficient between the two. c) Calculate the portfolio return and risk (standard deviation) of the two firms when d) Calculate the return and risk (stdev) of the portfolio after finding the minimum e) Calculate a), b), and c) on Excel. Use the template provided in the Excel file f) Draw the feasible allocation set (attainable portfolio) by changing weights for Write out all the setups for each calculation. you evenly split your money between them. variance (risk) portfolio weights for each. (HomeworkNol_FINC323.xlsx) in folder "Homework." Apple from 0 to 1 by the increment of 10% on Excel Problem #1 alculating Expected Returns and Standard Deviations: Discrete Probabilities INPUTS: Expected Return Standard Deviation A4 Product of Probability ofMarket Rate of Probability andDeviation from Scenario Return Return Expeoted Return Squared Deviation Sq. Dev. x Prob. Scenarico (4) (2)-D8 Best Case Most Likely Worst Case 20% 60% 20% 20% -1 0% 00 Exp. ret. Sum Variance Std. Dev. Squar root of variance Note: Calculations in the model have been reported to one decimal, so rounding differences may oocur 3. You have observed the following returns for Apple and Microsoft for last 3 years: Apple 0.15 0.1 0.13 Period Microsoft 0.07 0.05 0.03 a) Calculate each firm's return and sample standard deviation. Write out all the setups for each calculation. b) Calculate the sample covariance and correlation coefficient between the two. c) Calculate the portfolio return and risk (standard deviation) of the two firms when d) Calculate the return and risk (stdev) of the portfolio after finding the minimum e) Calculate a), b), and c) on Excel. Use the template provided in the Excel file f) Draw the feasible allocation set (attainable portfolio) by changing weights for Write out all the setups for each calculation. you evenly split your money between them. variance (risk) portfolio weights for each. (HomeworkNol_FINC323.xlsx) in folder "Homework." Apple from 0 to 1 by the increment of 10% on Excel
Step by Step Solution
There are 3 Steps involved in it

Get step-by-step solutions from verified subject matter experts