

Question: Question 2 20 points Production Function Y/N G B F E K/N The graph above represents the aggregate production function of a country, where Y/N
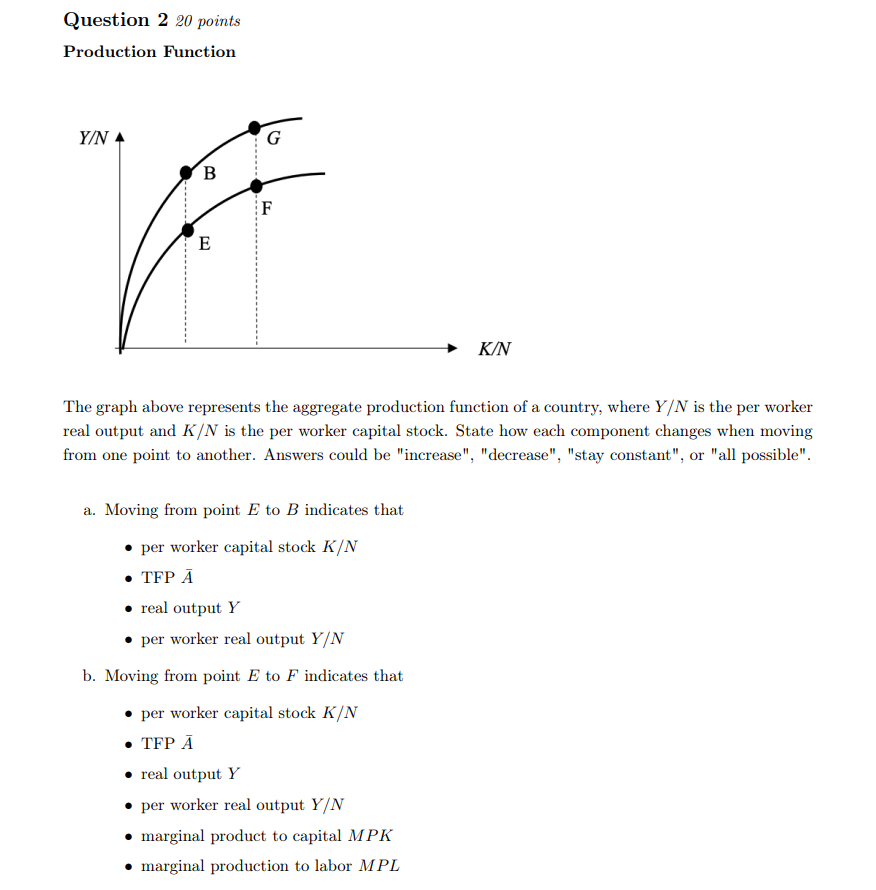
Question 2 20 points Production Function Y/N G B F E K/N The graph above represents the aggregate production function of a country, where Y/N is the per worker real output and K/N is the per worker capital stock. State how each component changes when moving from one point to another. Answers could be "increase", "decrease", "stay constant", or "all possible". a. Moving from point E to B indicates that per worker capital stock K/N TFP real output Y per worker real output Y/N b. Moving from point E to F indicates that per worker capital stock K/N TFP real output Y per worker real output Y/N marginal product to capital MPK marginal production to labor MPL
Step by Step Solution
There are 3 Steps involved in it

Get step-by-step solutions from verified subject matter experts