

Question: Problem 1: Analyzing Investments in Stock Selections Question 1: Construct a decision tree depicting the stock selection based on the information available on the above
Problem 1: Analyzing Investments in Stock Selections
Question 1: Construct a decision tree depicting the stock selection based on the information available on the above payoff table. Develop the decision tree using an Excel template or using the QM software.
Question 6: Using Bayes' theorem, compute the posterior probabilities (P(Si / Fi) for each.
Question 7a: Use the results from question 6, compute the EMVs for the two decision alternatives and indicate the best course of action you would recommend to the investor. Explain the rational of your decision.
Question 7b: Expand the decision tree (you developed in Question 1) to provide the results of your calculations to questions 6 and 7.
Question 10a: Compute the EVPI and the EVSI, and explain the meaning of their values to the investor.
Question 10b: Conduct a sensitivity analysis, and provide a sensitivity graph, of the investor's decision based on the probability of the state of the economy.
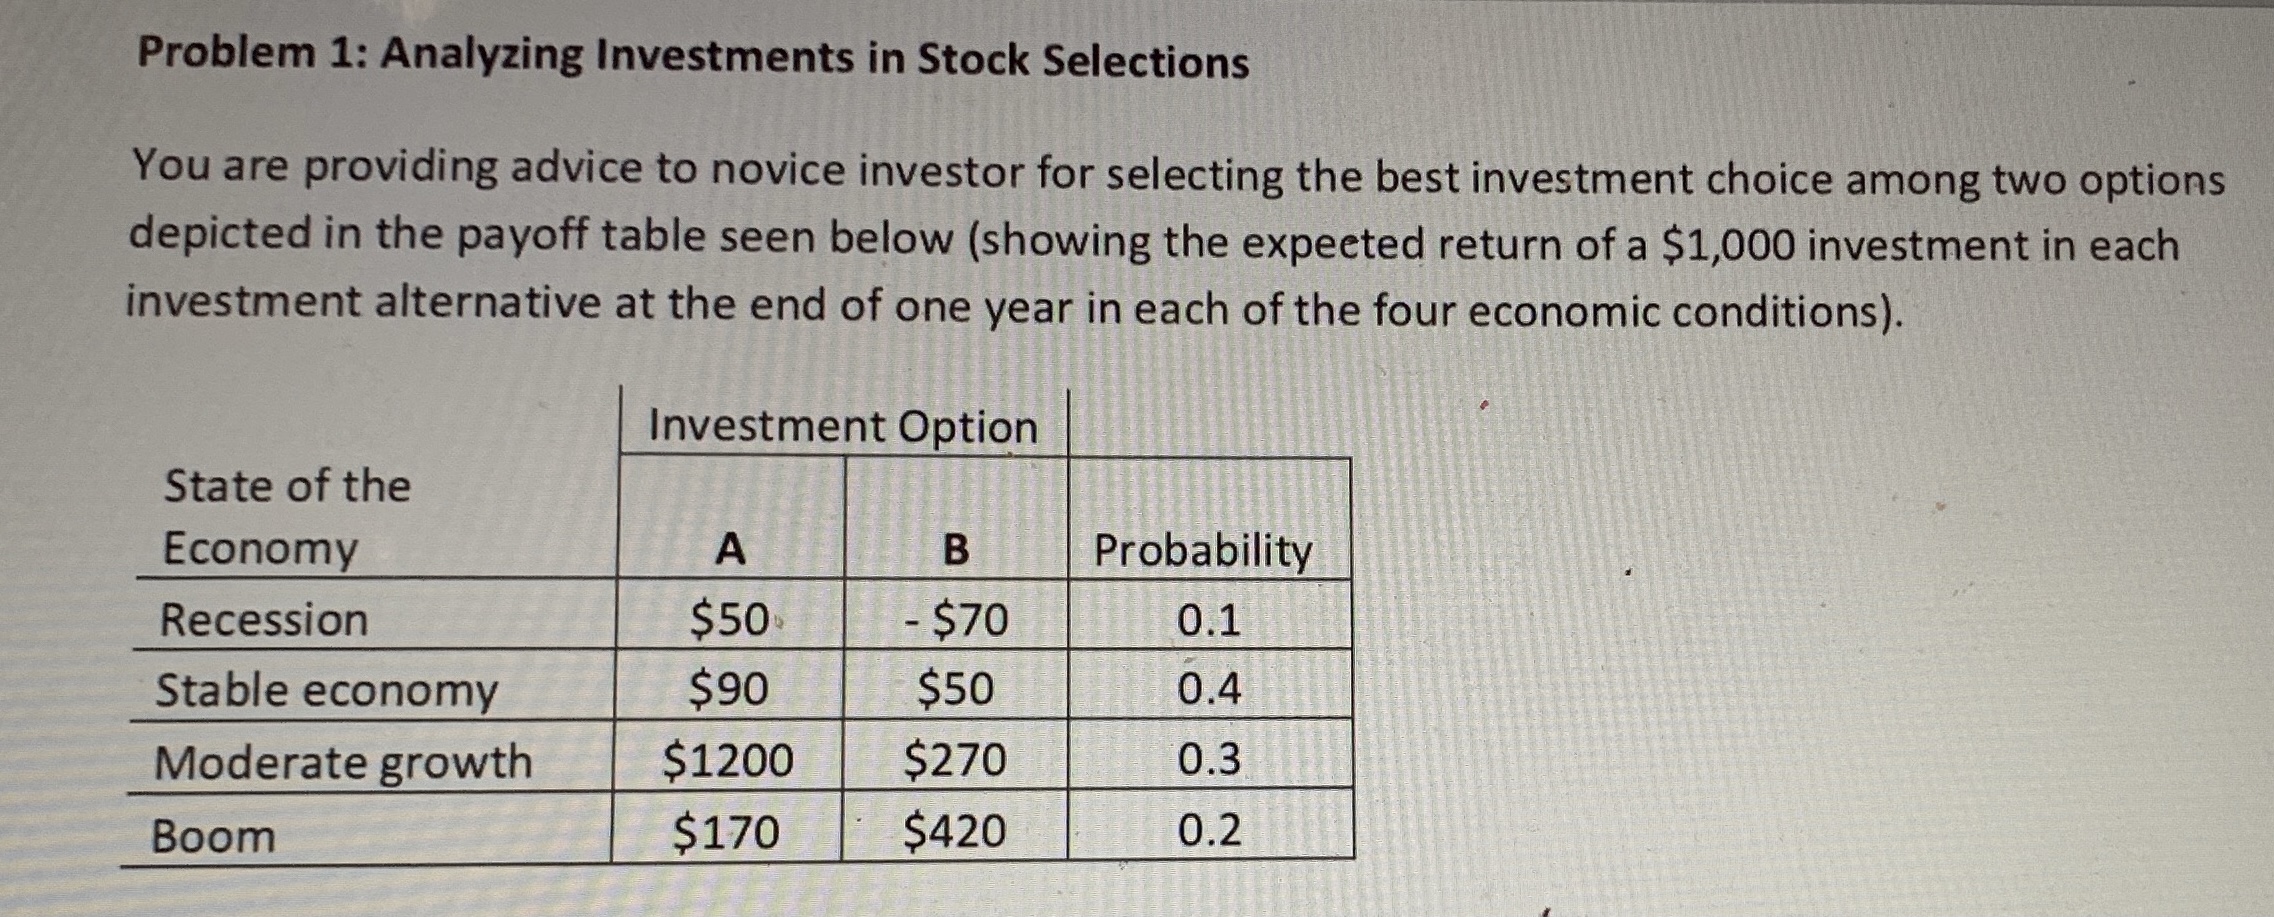
Problem 1: Analyzing Investments in Stock Selections You are providing advice to novice investor for selecting the best investment choice among two options depicted in the payoff table seen below (showing the expected return of a $1,000 investment in each investment alternative at the end of one year in each of the four economic conditions). Investment Option State of the Economy A B Probability Recession $50 $70 0.1 Stable economy $90 $50 0.4 Moderate growth $1200 $270 0.3 Boom $170 $420 0.2
Step by Step Solution
There are 3 Steps involved in it

Get step-by-step solutions from verified subject matter experts