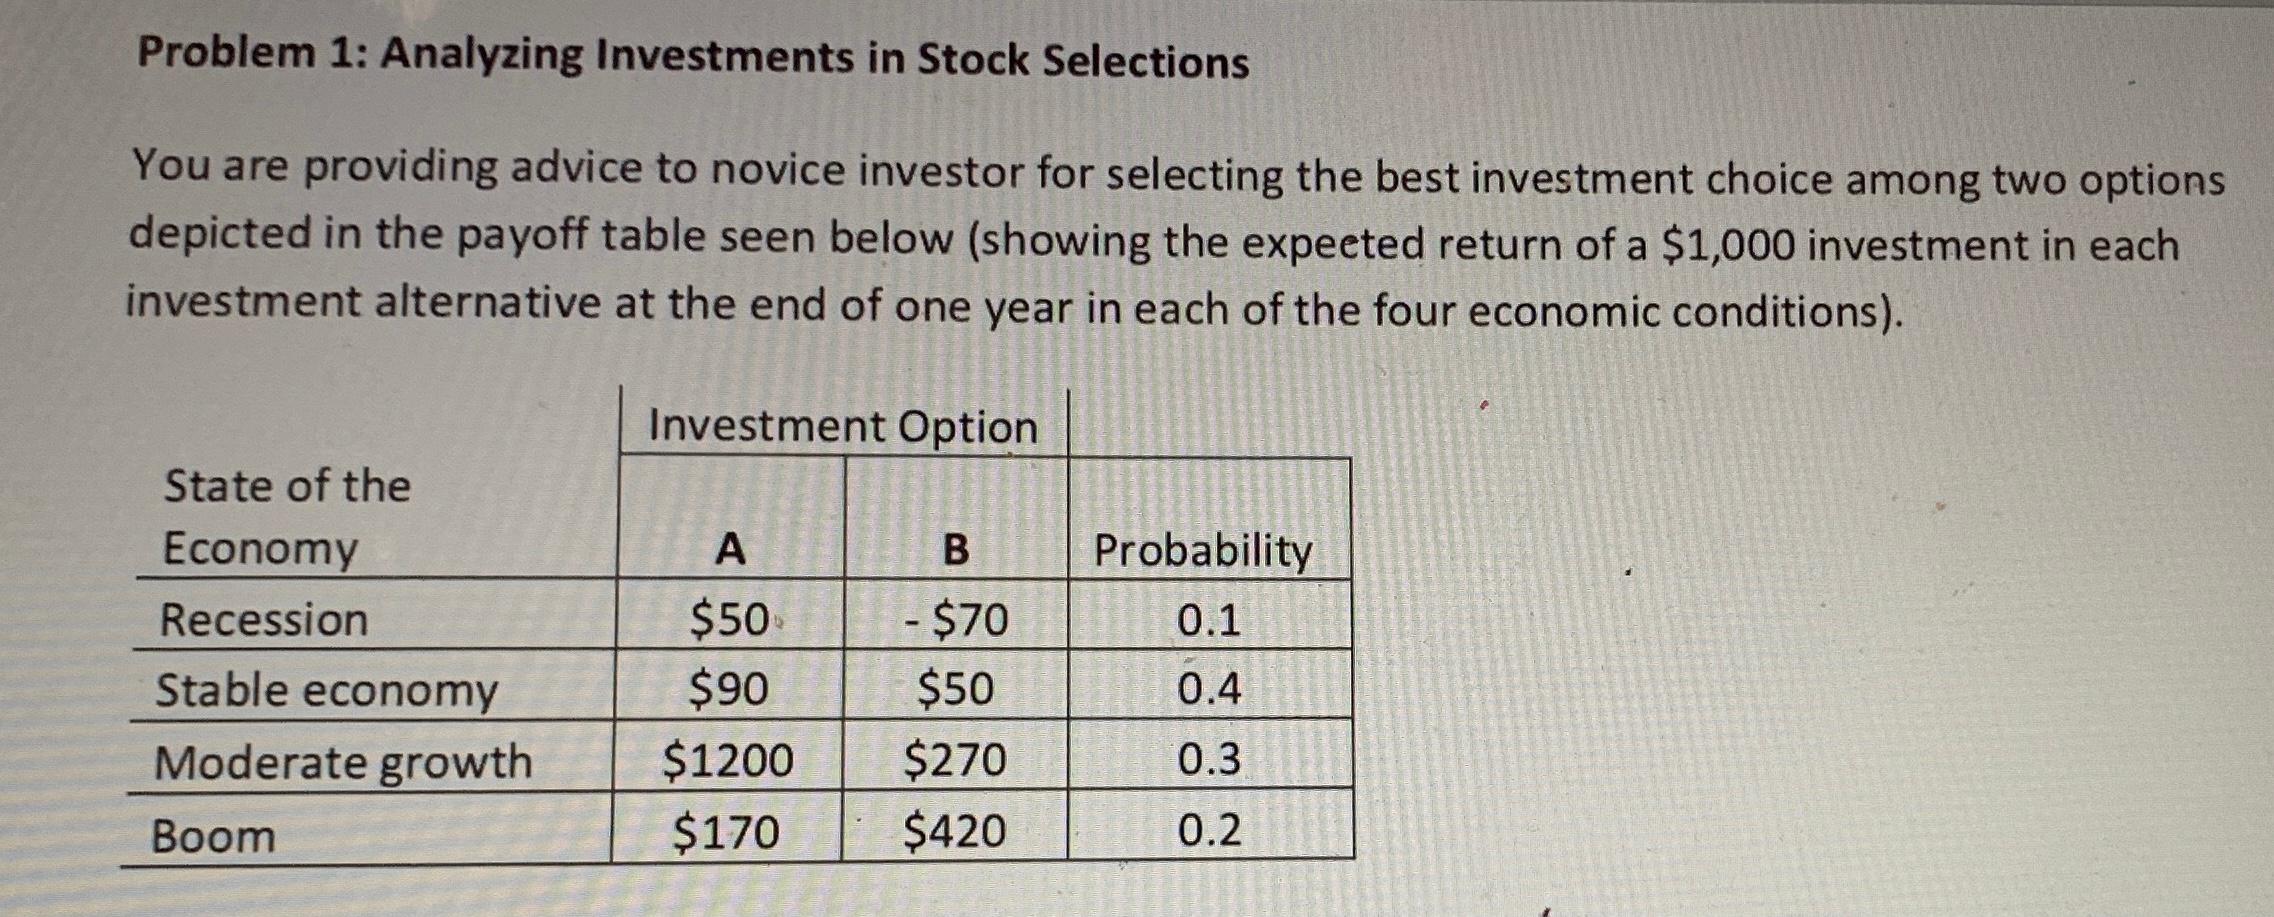
Question: Question 10b: Conduct a sensitivity analysis, and provide sensitivity graph, of the investors decision based on the probability of the state of the economy. Screenshot

Question 10b: Conduct a sensitivity analysis, and provide sensitivity graph, of the investors decision based on the probability of the state of the economy.

Screenshot Excel

Question 10b: Conduct a sensitivity analysis, and

Problem 1: Analyzing Investments in Stock Selections You are providing advice to novice investor for selecting the best investment choice among two options depicted in the payoff table seen below (showing the expeeted return of a $1,000 investment in each investment alternative at the end of one year in each of the four economic conditions). Investment Option State of the Economy Recession A B Probability 0.1 0.4 Stable economy Moderate growth $50 $90 $1200 $170 - $70 $50 $270 $420 0.3 Boom 0.2 - Problem 1: Analyzing Investments in Stock Selections You are providing advice to novice investor for selecting the best investment choice among two options depicted in the payoff table seen below (showing the expeeted return of a $1,000 investment in each investment alternative at the end of one year in each of the four economic conditions). Investment Option State of the Economy Recession A B Probability 0.1 0.4 Stable economy Moderate growth $50 $90 $1200 $170 - $70 $50 $270 $420 0.3 Boom 0.2

Step by Step Solution

There are 3 Steps involved in it

1 Expert Approved Answer
Step: 1 Unlock blur-text-image
Question Has Been Solved by an Expert!

Get step-by-step solutions from verified subject matter experts

Step: 2 Unlock
Step: 3 Unlock

Students Have Also Explored These Related General Management Questions!