

Question: Problem 1: Consider a binary hypothesis test problem as follows Ho: x= So + w H: x=Si+w where w~ N(0, 2) and s, and si
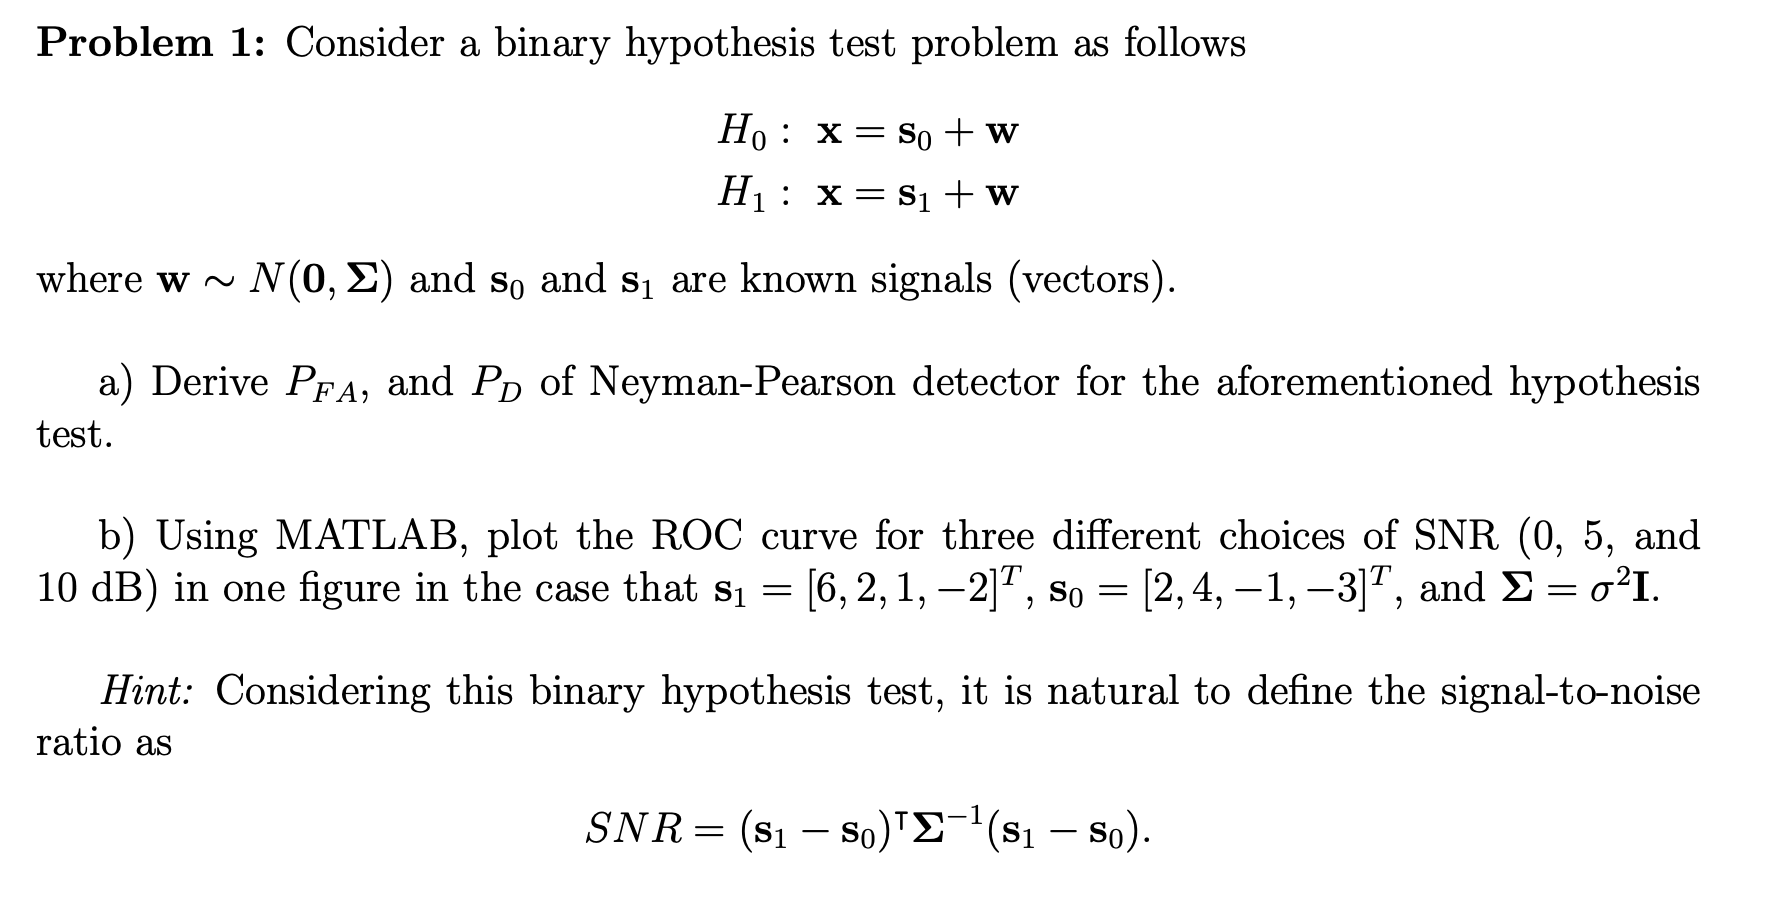
Problem 1: Consider a binary hypothesis test problem as follows Ho: x= So + w H: x=Si+w where w~ N(0, 2) and s, and si are known signals (vectors). a) Derive PFA, and PD of Neyman-Pearson detector for the aforementioned hypothesis test. b) Using MATLAB, plot the ROC curve for three different choices of SNR (0, 5, and 10 dB) in one figure in the case that s = [6, 2, 1, -2]", so = (2,4, -1, -3)?, and = oI. Hint: Considering this binary hypothesis test, it is natural to define the signal-to-noise ratio as SNR= (s - so)'E-'(s so). Problem 1: Consider a binary hypothesis test problem as follows Ho: x= So + w H: x=Si+w where w~ N(0, 2) and s, and si are known signals (vectors). a) Derive PFA, and PD of Neyman-Pearson detector for the aforementioned hypothesis test. b) Using MATLAB, plot the ROC curve for three different choices of SNR (0, 5, and 10 dB) in one figure in the case that s = [6, 2, 1, -2]", so = (2,4, -1, -3)?, and = oI. Hint: Considering this binary hypothesis test, it is natural to define the signal-to-noise ratio as SNR= (s - so)'E-'(s so)
Step by Step Solution
There are 3 Steps involved in it

Get step-by-step solutions from verified subject matter experts