

Question: Problem # 1 : Consider the sieve analysis and hydrometer data below. ( a ) Plot the particle size distribution curve for each of the
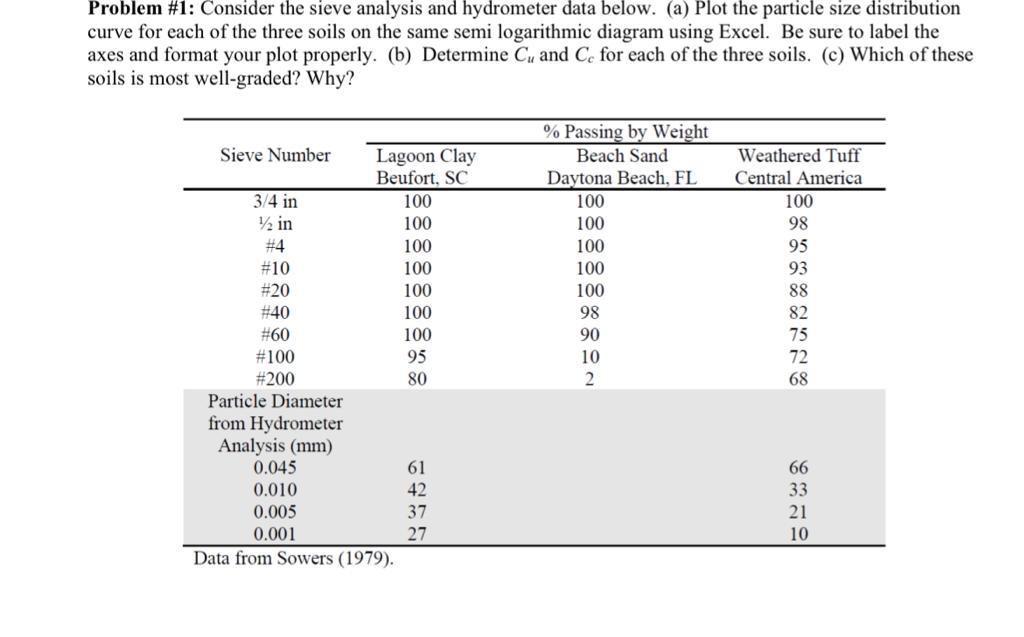
Problem #: Consider the sieve analysis and hydrometer data below. a Plot the particle size distribution curve for each of the three soils on the same semi logarithmic diagram using Excel. Be sure to label the axes and format your plot properly. b Determine and for each of the three soils. c Which of these soils is most wellgraded? Why?
tableSieve Number, Passing by WeighttableLagoon ClayBeufort SCtableBeach SandDaytona Beach, FLtableWeathered TuffCentral America in in#######Particle Diameter,,,from Hydrometer,,,Analysis mm
Data from Sowers
Step by Step Solution
There are 3 Steps involved in it
1 Expert Approved Answer
Step: 1 Unlock

Question Has Been Solved by an Expert!
Get step-by-step solutions from verified subject matter experts
Step: 2 Unlock
Step: 3 Unlock