

Question: Problem #1 Create a properly formatted Income Statement (including earnings per share) for HW Enterprises from the information provided for the year ended December 31,
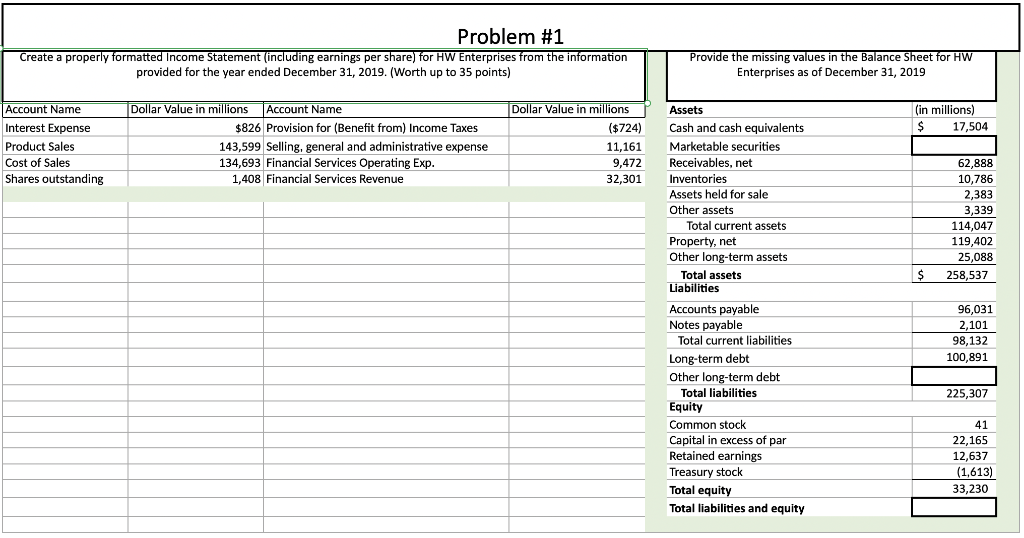
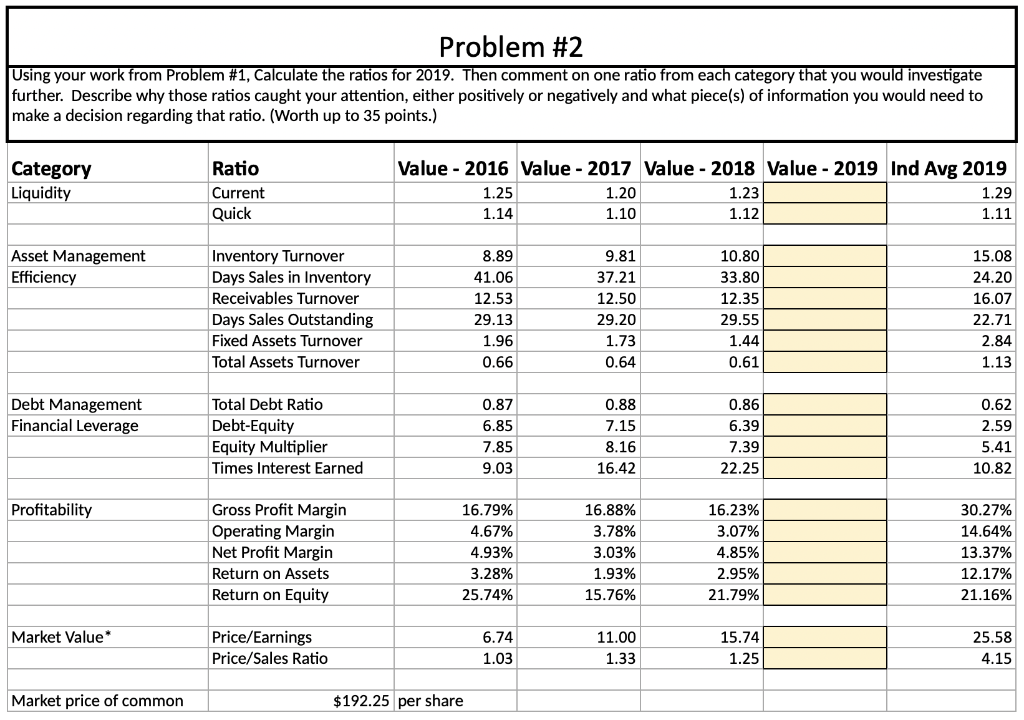
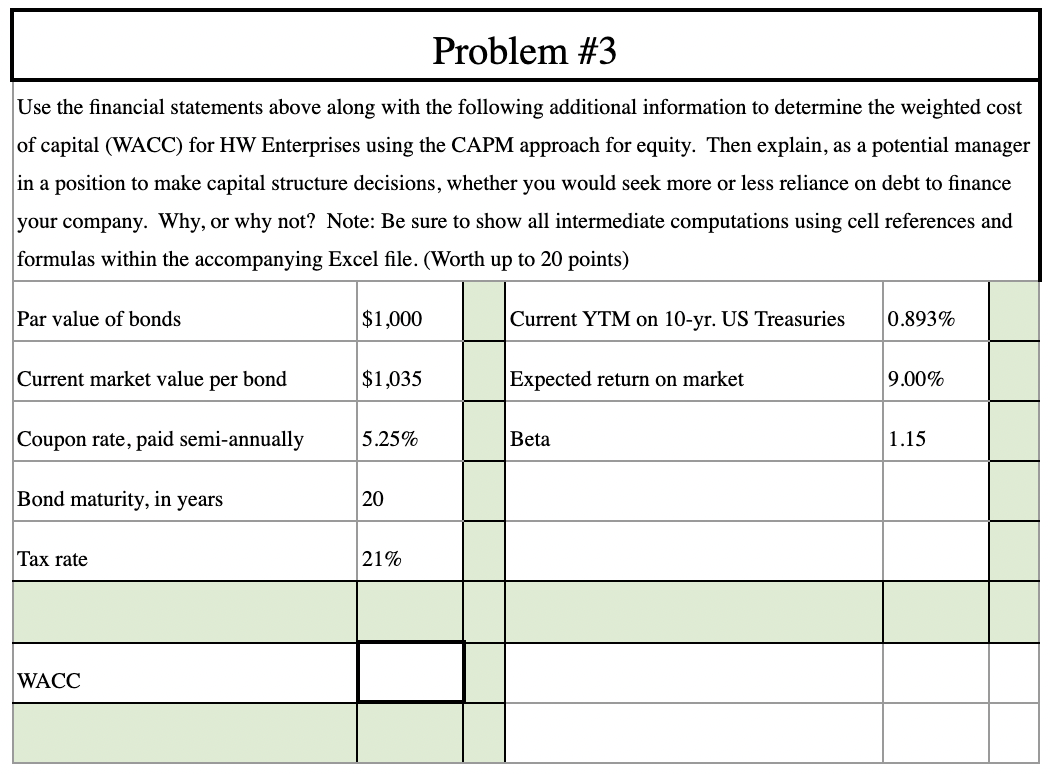
Problem #1 Create a properly formatted Income Statement (including earnings per share) for HW Enterprises from the information provided for the year ended December 31, 2019. (Worth up to 35 points) Provide the missing values in the Balance Sheet for HW Enterprises as of December 31, 2019 (in millions) $ 17,504 Account Name Interest Expense Product Sales Cost of Sales Shares outstanding Dollar Value in millions Account Name $826 Provision for (Benefit from) Income Taxes 143,599 Selling, general and administrative expense 134,693 Financial Services Operating Exp. 1,408 Financial Services Revenue Dollar Value in millions ($724) 11,161 9,472 32,301 Assets Cash and cash equivalents Marketable securities Receivables, net Inventories Assets held for sale Other assets Total current assets 62,888 10,786 2,383 3,339 114,047 119,402 25,088 258,537 Property, net $ 96,031 2,101 98,132 100,891 Other long-term assets Total assets Liabilities Accounts payable Notes payable Total current liabilities Long-term debt Other long-term debt Total liabilities Equity Common stock Capital in excess of par Retained earnings Treasury stock Total equity Total liabilities and equity 225,307 41 22,165 12,637 (1,613) 33,230 Problem #2 Using your work from Problem #1, Calculate the ratios for 2019. Then comment on one ratio from each category that you would investigate further. Describe why those ratios caught your attention, either positively or negatively and what piece(s) of information you would need to make a decision regarding that ratio. (Worth up to 35 points.) Category Liquidity Ratio Current Quick Value - 2016 Value - 2017 Value - 2018 Value - 2019 Ind Avg 2019 1.25 1.20 1.23 1.29 1.14 1.10 1.12 1.11 Asset Management Efficiency Inventory Turnover Days Sales in Inventory Receivables Turnover Days Sales Outstanding Fixed Assets Turnover Total Assets Turnover 8.89 41.06 12.53 29.13 1.96 0.66 9.81 37.21 12.50 29.20 1.73 0.64 10.80 33.80 12.35 29.55 1.44 0.61 15.08 24.20 16.07 22.71 2.84 1.13 Debt Management Financial Leverage Total Debt Ratio Debt-Equity Equity Multiplier Times Interest Earned 0.87 6.85 7.85 9.03 0.88 7.15 8.16 16.42 0.86 6.39 7.39 22.25 0.62 2.59 5.41 10.82 Profitability Gross Profit Margin Operating Margin Net Profit Margin Return on Assets Return on Equity 16.79% 4.67% 4.93% 3.28% 25.74% 16.88% 3.78% 3.03% 1.93% 15.76% 16.23% 3.07% 4.85% 2.95% 21.79% 30.27% 14.64% 13.37% 12.17% 21.16% Market Value* 25.58 Price/Earnings Price/Sales Ratio 6.74 1.03 11.00 1.33 15.74 1.25 4.15 Market price of common $192.25 per share Problem #3 Use the financial statements above along with the following additional information to determine the weighted cost of capital (WACC) for HW Enterprises using the CAPM approach for equity. Then explain, as a potential manager in a position to make capital structure decisions, whether you would seek more or less reliance on debt to finance your company. Why, or why not? Note: Be sure to show all intermediate computations using cell references and formulas within the accompanying Excel file. (Worth up to 20 points) Par value of bonds $1,000 Current YTM on 10-yr. US Treasuries 0.893% Current market value per bond $1,035 Expected return on market 9.00% Coupon rate, paid semi-annually 5.25% Beta 1.15 Bond maturity, in years 20 Tax rate 21% WACC
Step by Step Solution
There are 3 Steps involved in it

Get step-by-step solutions from verified subject matter experts