

Question: Problem 1 Data provided on BB for this problem are estimated trips generated from 1 2 0 traffic analysis zones. These data were collected to
Problem
Data provided on BB for this problem are estimated trips generated from traffic analysis zones.
These data were collected to understand the mobility pattern during offpeak hours. The definition of
the attributes in the dataset is as follows:
Average zonal income in thousands income
Zonal population in thousands pop
Average number of vehicles in the household veh
Average number of children in a household children
Average trip rates during offpeak period Tripsrates
Task: Use Python particularly statsmodels packoge to calibrate linear regression models that estimate
triprates.
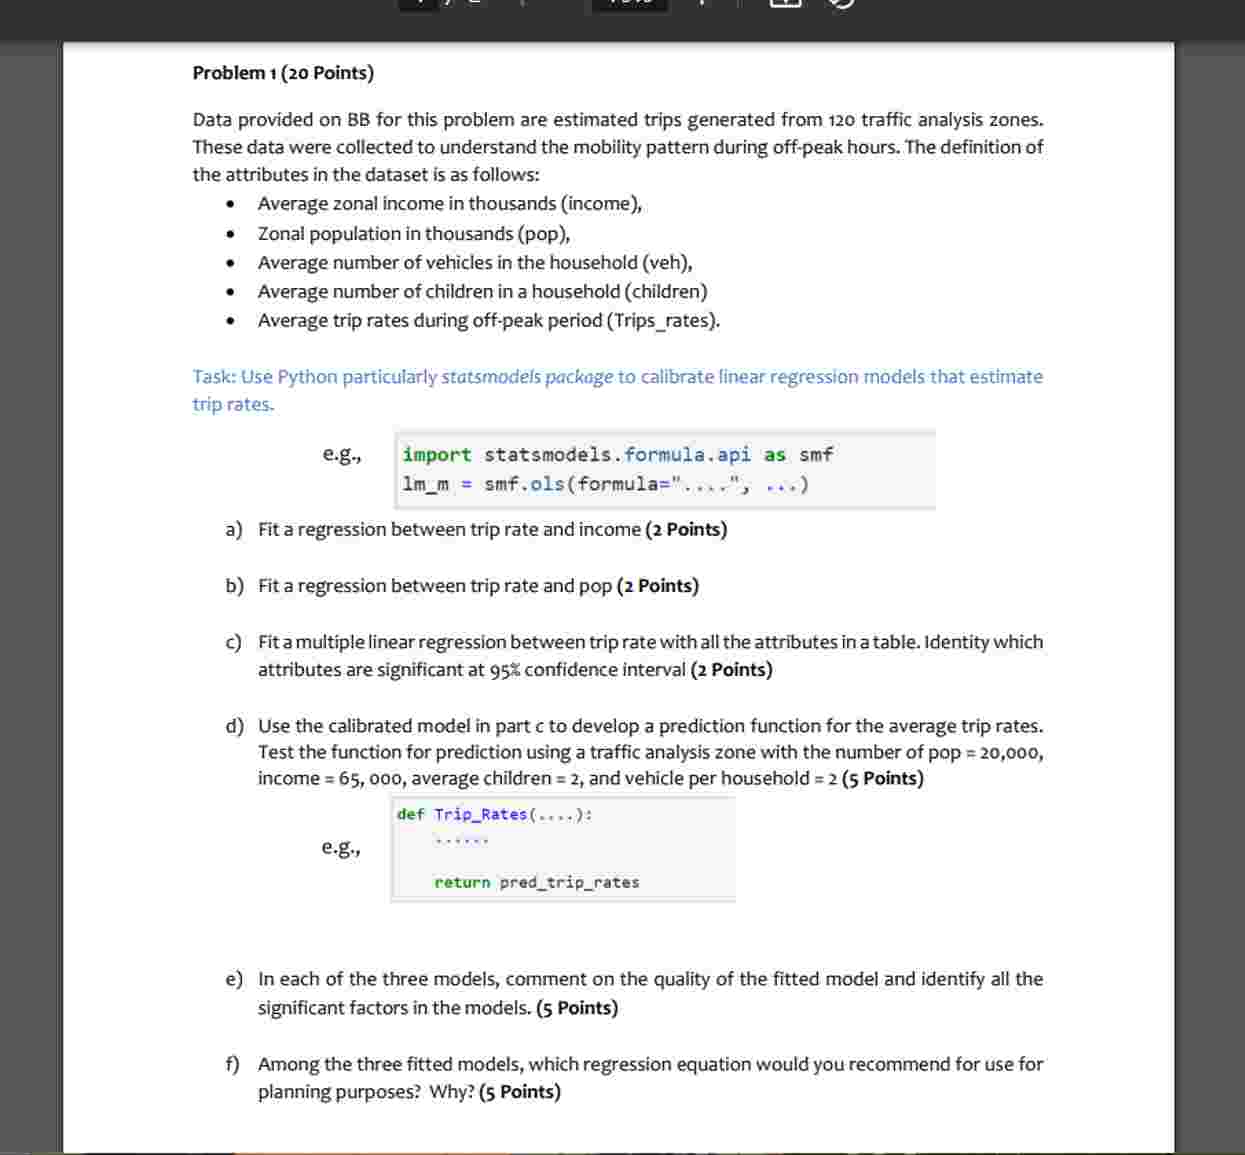
eg import statsmodels.formula.api as smf
Imm smfolsformula
a Fit a regression between trip rate and income Points
b Fit a regression between trip rate and pop Points
c Fit a multiple linear regression between trip rate with all the attributes in a table. Identity which
attributes are significant at confidence interval Points
d Use the calibrated model in part c to develop a prediction function for the average trip rates.
Test the function for prediction using a traffic analysis zone with the number of pop
income average children and vehicle per household Points
def TripRates:
eg
return predtriprates
e In each of the three models, comment on the quality of the fitted model and identify all the
significant factors in the models. Points
f Among the three fitted models, which regression equation would you recommend for use for
planning purposes? Why? Points
Step by Step Solution
There are 3 Steps involved in it
1 Expert Approved Answer
Step: 1 Unlock

Question Has Been Solved by an Expert!
Get step-by-step solutions from verified subject matter experts
Step: 2 Unlock
Step: 3 Unlock