

Question: Problem 1: Emulation of R in Python Demonstrate Python analogues of the following R code blocks from the previous homework. Hints: The Python statsmodels module
Problem 1: Emulation of R in Python
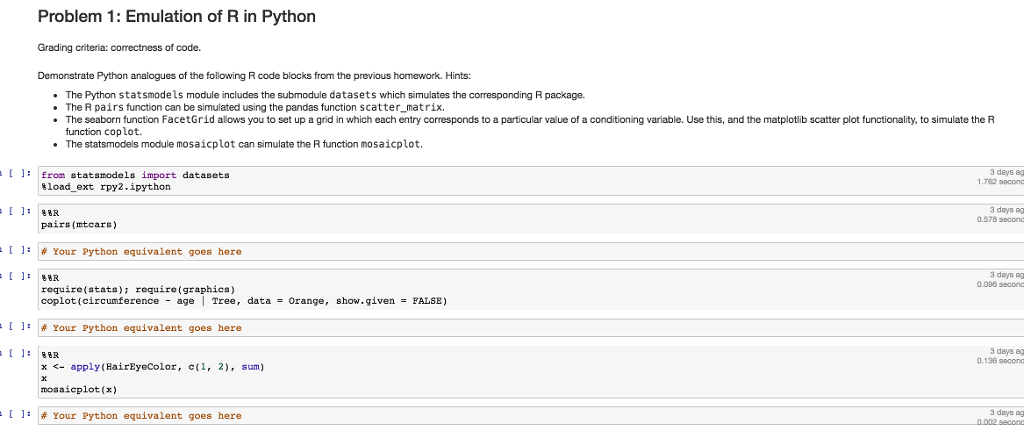
Demonstrate Python analogues of the following R code blocks from the previous homework. Hints:
The Python statsmodels module includes the submodule datasets which simulates the corresponding R package.
The R pairs function can be simulated using the pandas function scatter_matrix.
The seaborn function FacetGrid allows you to set up a grid in which each entry corresponds to a particular value of a conditioning variable. Use this, and the matplotlib scatter plot functionality, to simulate the R function coplot.
The statsmodels module mosaicplot can simulate the R function mosaicplot.
Problem 1: Emulation of R in Pythorn Grading criteria: correctness of code. Demonstrate Python analogues of the following R code blocks from the previous homework. Hints: The Python statsmodels module includes the submodule datasets which simulates the corresponding R package. The R pairs function can be simulated using the pandas function scatter matrix The seaborn function FacetGrid allows you to set up a grid in which each entry corresponds to a particular value of a conditioning variable. Use this, and the matplotlib scatter plot functionality, to simulate the R function coplot. The statsmodels module mosaicplot can simulate the R function mosaicplot. Erom statamodels import datasets 3days a 762 sconc % load.-ext rpy2.ipython 3 days a 0.578 5econa pairs (mtcars) [ ] # Your Python equivalent goes here 3 days ag 0.096 second require(stats): require(graphics) coplot ( circumference-age | Tree, data=Orange, show. given = FALSE) [ ]: Your Python equivalent goes here 3 days ag 0.136 secono
Step by Step Solution
There are 3 Steps involved in it

Get step-by-step solutions from verified subject matter experts