

Question: Problem 1 In this problem. we revisit the CPS dataset we have used in the lecture. The background information of the data is quoted from
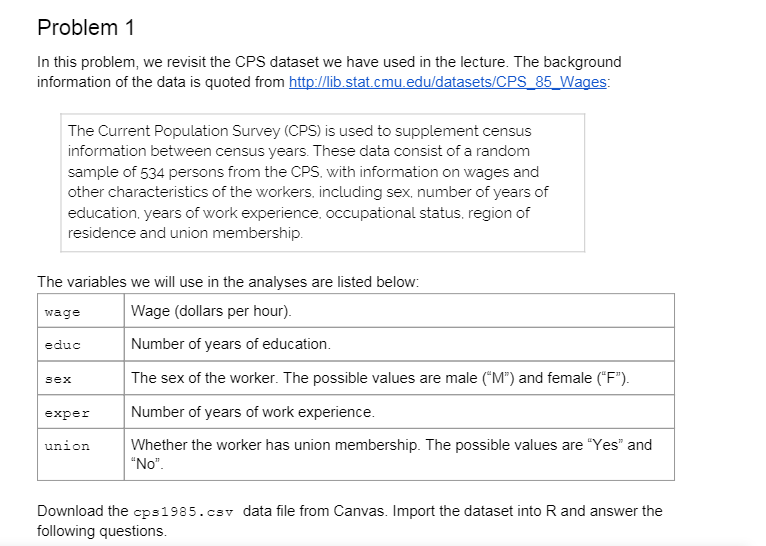
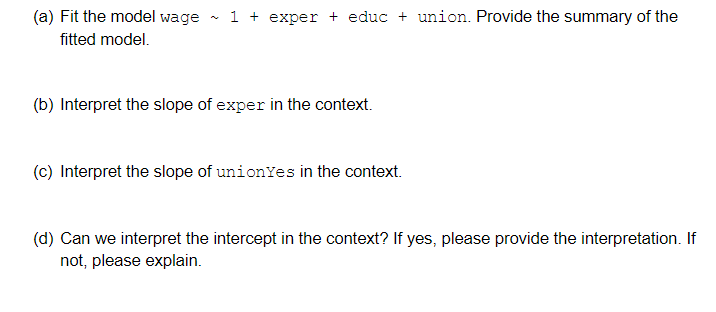
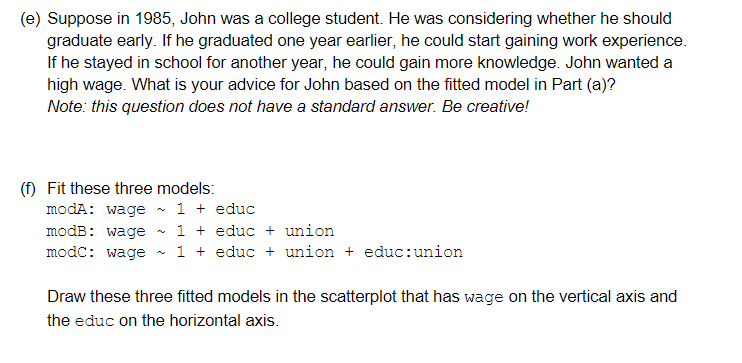
Problem 1 In this problem. we revisit the CPS dataset we have used in the lecture. The background information of the data is quoted from httpw'lib.stat.cmu.eduldatasets.lCPS 85 1I."'u'ages: The Current Population Survey {CPS} is used to supplement census information between census years. These data consist of a random sample of 534 persons from the CPS. with information on wages and other characteristics of the workers. including sex. number of years of education. years of work experience. occupational status. region of residence and union membership. The variables we will use in the analyses are listed below: Wage (dollars per hour}. Number of years of education. E The sex of the worker. The possible values are male (\"M") and female {\"F\"}. Number of years of work experience. Whether the worker has union membership. The possible values are \"Yes" and "No\". Download the cps 1 38 5 . csv data le from Canvas. Import the dataset into R and answer the following questions. (a) Fit the model wage ~ 1 + exper + educ + union. Provide the summary of the fitted model. (b) Interpret the slope of exper in the context. (c) Interpret the slope of unionYes in the context. (d) Can we interpret the intercept in the context? If yes, please provide the interpretation. If not, please explain.(e) Suppose in 1985, John was a college student. He was considering whether he should graduate early. If he graduated one year earlier, he could start gaining work experience. If he stayed in school for another year, he could gain more knowledge. John wanted a high wage. What is your advice for John based on the fitted model in Part (a)? Note: this question does not have a standard answer. Be creative! (f) Fit these three models: modA: wage ~ 1 + educ modB: wage ~ 1 + educ + union modC: wage ~ 1 + educ + union + educ:union Draw these three fitted models in the scatterplot that has wage on the vertical axis and the educ on the horizontal axis
Step by Step Solution
There are 3 Steps involved in it

Get step-by-step solutions from verified subject matter experts