

Question: Problem 1 on speed - flow - density diagram ( 2 4 points ) : A traffic engineering study has revealed the following attributes for
Problem on speedflowdensity diagram points:
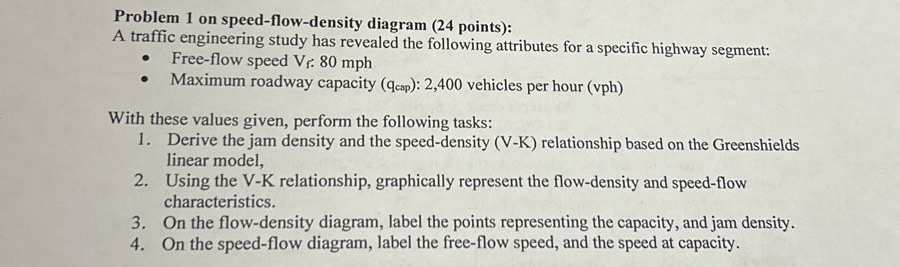
A traffic engineering study has revealed the following attributes for a specific highway segment:
Freeflow speed
Maximum roadway capacity : vehicles per hour
With these values given, perform the following task:
Derive the jam density and the speeddensity VK relationship based on the Greenshields linear model,
Using the relationship, graphically represent the flowdensity and speedflow characteristics.
On the flowdensity diagram, label the points representing the capacity, and jam density.
On the speedflow diagram, label the freeflow speed, and the speed at capacity.
Step by Step Solution
There are 3 Steps involved in it
1 Expert Approved Answer
Step: 1 Unlock

Question Has Been Solved by an Expert!
Get step-by-step solutions from verified subject matter experts
Step: 2 Unlock
Step: 3 Unlock