

Question: Problem 1: Plot two diagrams that show the TCP congestion window for Taho and Reno mechanisms if the initial threshold is set to 14 Consider
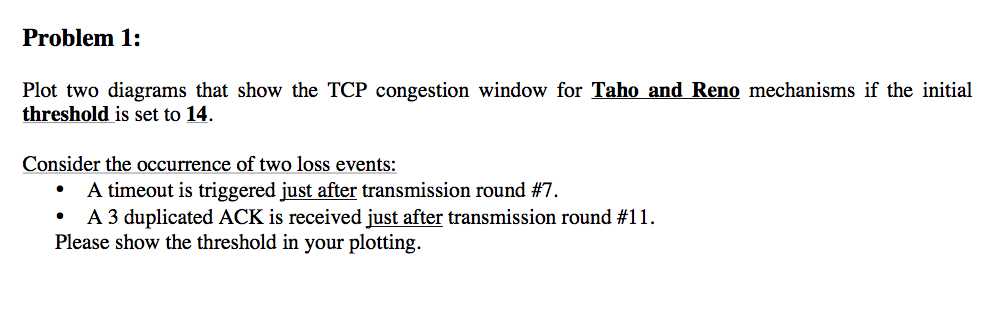
Problem 1: Plot two diagrams that show the TCP congestion window for Taho and Reno mechanisms if the initial threshold is set to 14 Consider the occurrence of two loss events: . A timeout is triggered just after transmission round #7. . A 3 duplicated ACK is received just after transmission round #11. Please show the threshold in your plotting
Step by Step Solution
There are 3 Steps involved in it
1 Expert Approved Answer
Step: 1 Unlock

Question Has Been Solved by an Expert!
Get step-by-step solutions from verified subject matter experts
Step: 2 Unlock
Step: 3 Unlock