

Question: Problem 1 (Random Data) The following table contains a set of randomly generated values for X and Y, using Excel functions Y = 5*rand() and
Problem 1 (Random Data)
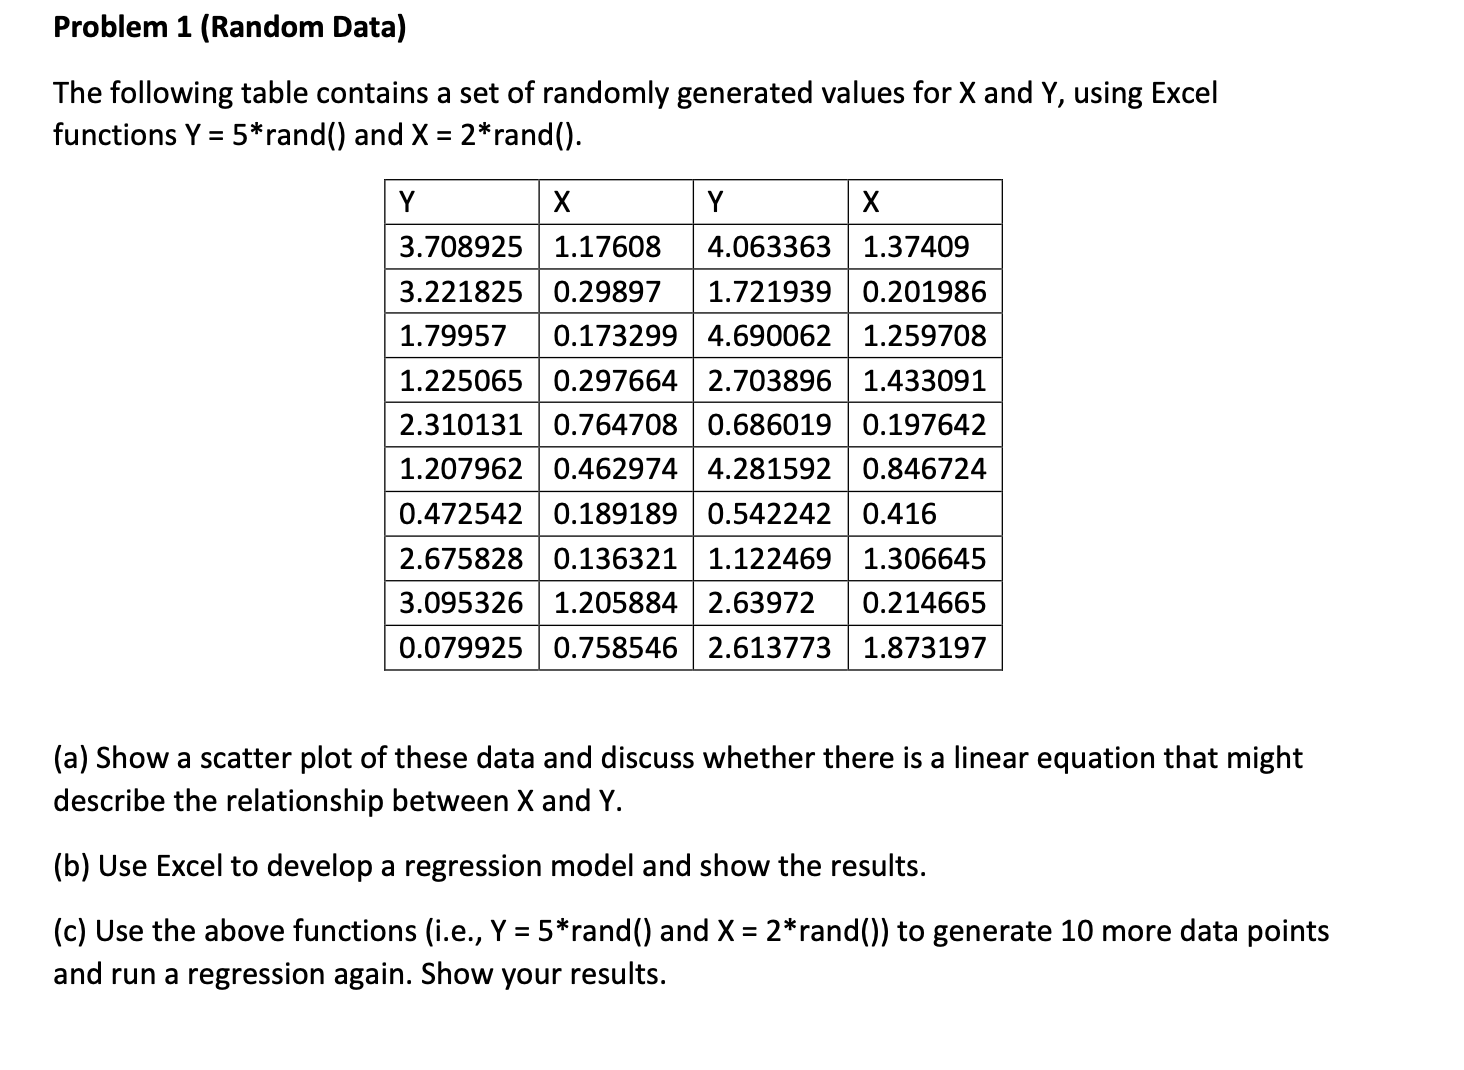
The following table contains a set of randomly generated values for X and Y, using Excel functions Y = 5*rand() and X = 2*rand().
YXYX 3.708925 1.17608 4.063363 1.37409 3.221825 0.29897 1.721939 0.201986 1.79957 0.173299 4.690062 1.259708 1.225065 0.297664 2.703896 1.433091 2.310131 0.764708 0.686019 0.197642 1.207962 0.462974 4.281592 0.846724 0.472542 0.189189 0.542242 0.416 2.675828 0.136321 1.122469 1.306645 3.095326 1.205884 2.63972 0.214665 0.079925 0.758546 2.613773 1.873197
(a) Show a scatter plot of these data and discuss whether there is a linear equation that might describe the relationship between X and Y.
(b) Use Excel to develop a regression model and show the results.
(c) Use the above functions (i.e., Y = 5*rand() and X = 2*rand()) to generate 10 more data points and run a regression again. Show your results.
Problem 1 (Random Data) The following table contains a set of randomly generated values for X and Y, using Excel functions Y = 5*rand() and X = 2*rand(). 3.703925 1.37409 3.221325 0.201936 1.79957 0.173299 4.690062 1.259708 1.225065 0.297664 2.703896 1.433091 2.310131 0.764708 0.686019 0.197642 1.207962 0.462974 4.231592 0.346724 2.675323 1.306645 3.095326 0.214665 0.079925 0.758546 2.613773 1.873197 (a) Show a scatter plot of these data and discuss whether there is a linear equation that might describe the relationship between X and Y. (b) Use Excel to develop a regression model and show the results. (c) Use the above functions (i.e., Y = 5*rand() and X = 2*rand()) to generate 10 more data points and run a regression again. Show your results
Step by Step Solution
There are 3 Steps involved in it

Get step-by-step solutions from verified subject matter experts