

Question: Problem # 1 Steady - State Conduction in . Two Dimensional slab figure shown below at steady - state conditions can be represented by the
Problem #
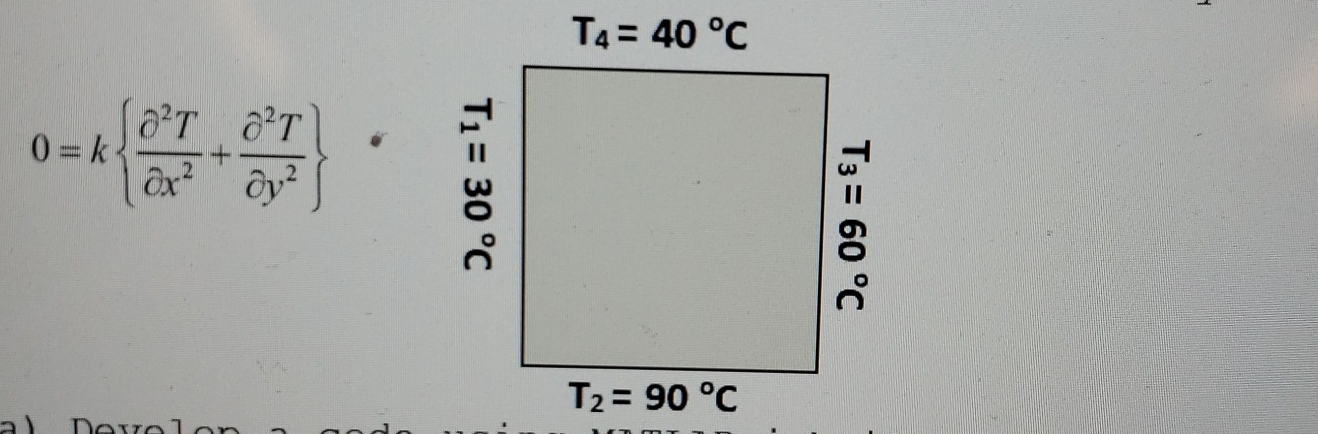
SteadyState Conduction in Two Dimensional slab figure shown below at steadystate conditions can be represented by the following equation:
a Develop a code using MATLAB inbuilt functions and plot the temperature contour plots as per the boundary conditions mentioned in the figure. Use two different grid points: and in both directions.
reshape;
Temperature profile
;
Tmatrixreshape ;
contourTmatrix;
b Develop a code using your own logical code such as nested for loops and plot the temperature contour plots as per the boundary conditions mentioned in the figure. Use two different grid points: and in both directions.
kTdeg CTdeg CTdeg CTdeg C explain and show all work write out the matlab code
Step by Step Solution
There are 3 Steps involved in it
1 Expert Approved Answer
Step: 1 Unlock

Question Has Been Solved by an Expert!
Get step-by-step solutions from verified subject matter experts
Step: 2 Unlock
Step: 3 Unlock