

Question: Problem 1 Table below shows the historical returns for Companies A, B and C Year 1 Company A 30% Company B Company C 26%
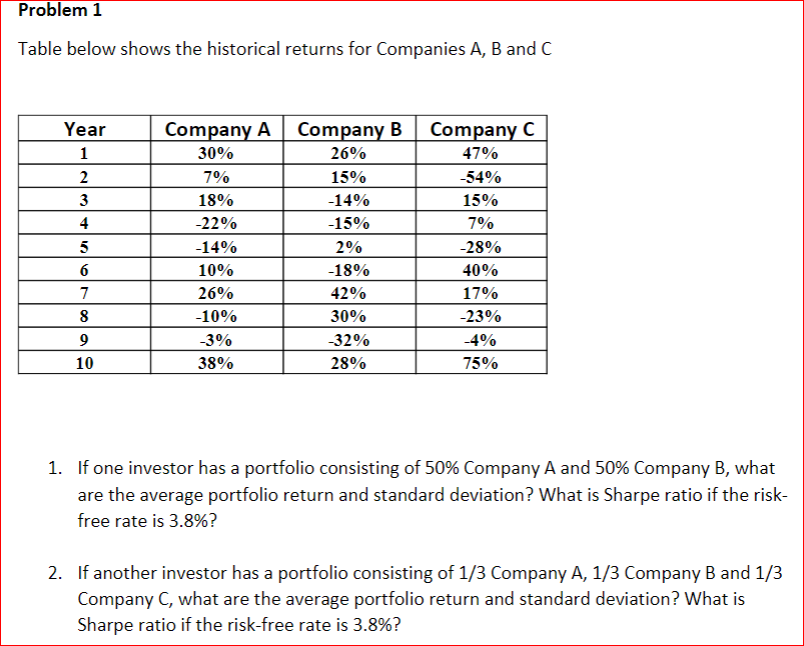
Problem 1 Table below shows the historical returns for Companies A, B and C Year 1 Company A 30% Company B Company C 26% 47% 2 7% 15% -54% 3 18% -14% 15% 4 -22% -15% 7% 5 -14% 2% -28% 6 10% -18% 40% 7 26% 42% 17% 8 -10% 30% -23% 9 -3% -32% -4% 10 38% 28% 75% 1. If one investor has a portfolio consisting of 50% Company A and 50% Company B, what are the average portfolio return and standard deviation? What is Sharpe ratio if the risk- free rate is 3.8%? 2. If another investor has a portfolio consisting of 1/3 Company A, 1/3 Company B and 1/3 Company C, what are the average portfolio return and standard deviation? What is Sharpe ratio if the risk-free rate is 3.8%?
Step by Step Solution
There are 3 Steps involved in it

Get step-by-step solutions from verified subject matter experts