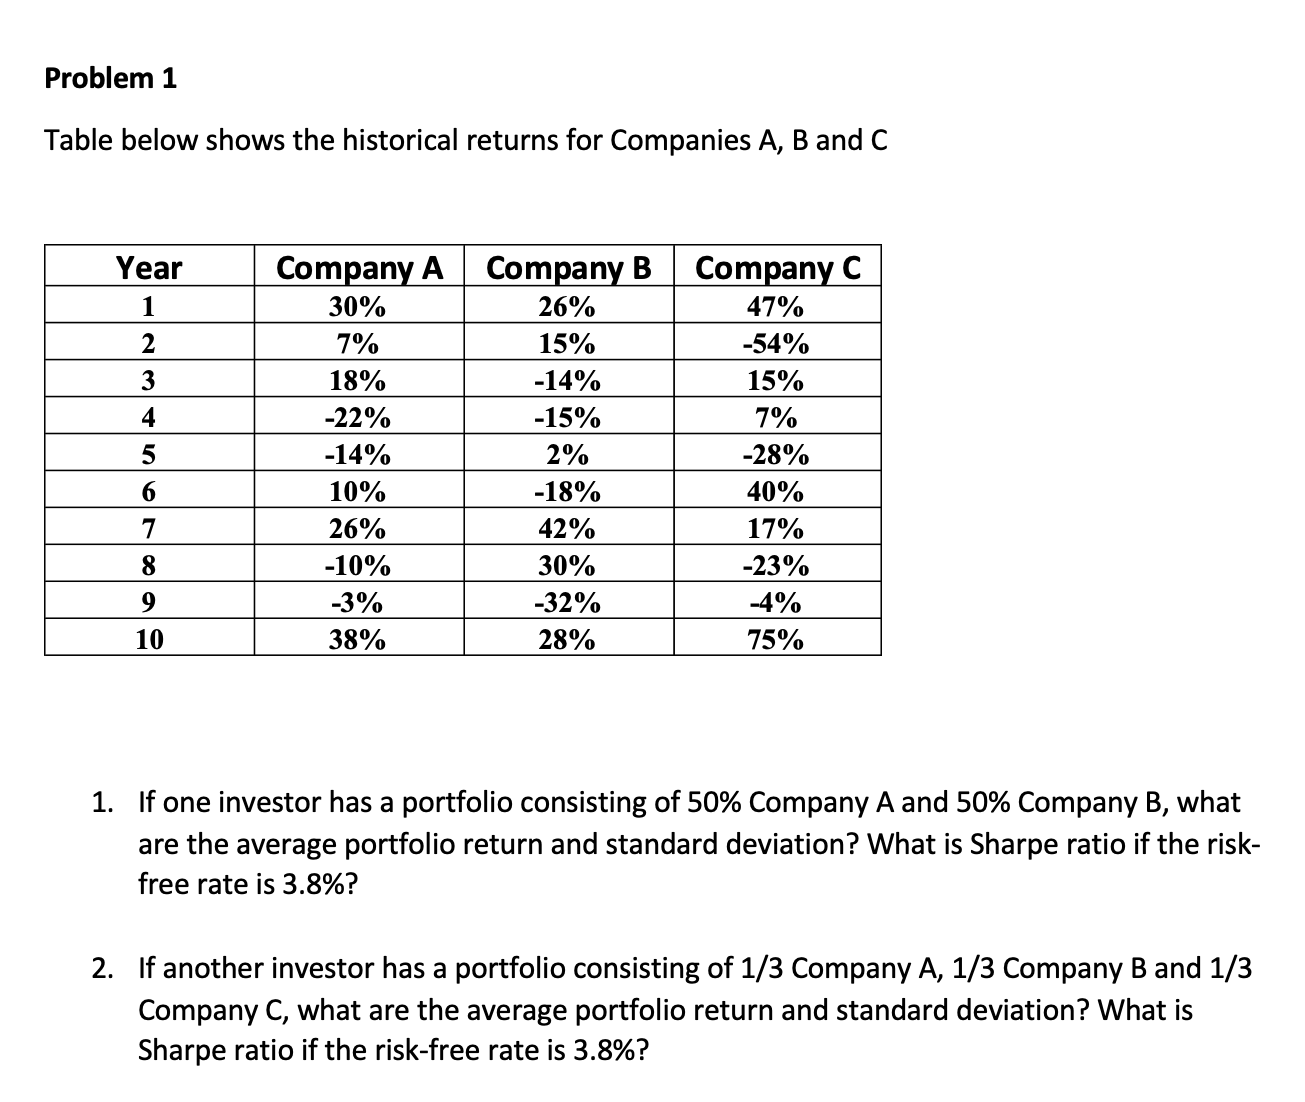
Question: Problem 1 Table below shows the historical returns for Companies A, B and C Year Company A Company B Company C 1 30% 26% 47%

Problem 1 Table below shows the historical
Problem 1 Table below shows the historical returns for Companies A, B and C Year Company A Company B Company C 1 30% 26% 47% 7% 15% -54% 18% -14% 15% -22% -15% 7% JQUI AWN -14% 2% -28% 10% -18% 40% 26% 42% 17% 8 -10% 30% -23% -3% -32% -4% 10 38% 28% 75% 1. If one investor has a portfolio consisting of 50% Company A and 50% Company B, what are the average portfolio return and standard deviation? What is Sharpe ratio if the risk- free rate is 3.8%? 2. If another investor has a portfolio consisting of 1/3 Company A, 1/3 Company B and 1/3 Company C, what are the average portfolio return and standard deviation? What is Sharpe ratio if the risk-free rate is 3.8%

Step by Step Solution

There are 3 Steps involved in it

1 Expert Approved Answer
Step: 1 Unlock blur-text-image
Question Has Been Solved by an Expert!

Get step-by-step solutions from verified subject matter experts

Step: 2 Unlock
Step: 3 Unlock

Students Have Also Explored These Related Finance Questions!