

Question: Problem 1. The following concentration data represents total nitrogen reported in mg/l as N that were measured in a batch experiments over a period of
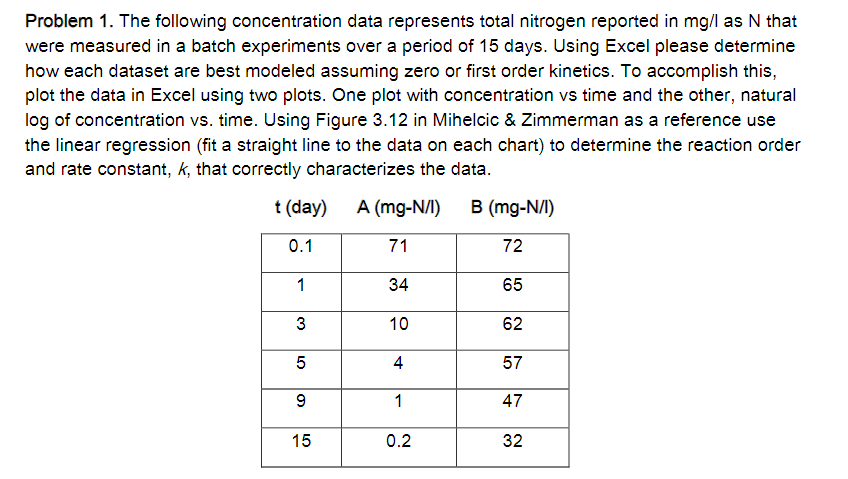
Problem 1. The following concentration data represents total nitrogen reported in mg/l as N that were measured in a batch experiments over a period of 15 days. Using Excel please determine how each dataset are best modeled assuming zero or first order kinetics. To accomplish this, plot the data in Excel using two plots. One plot with concentration vs time and the other, natural log of concentration vs. time. Using Figure 3.12 in Mihelcic \& Zimmerman as a reference use the linear regression (fit a straight line to the data on each chart) to determine the reaction order and rate constant, k, that correctly characterizes the data
Step by Step Solution
There are 3 Steps involved in it

Get step-by-step solutions from verified subject matter experts