

Question: Problem 1. The table below shows the prices of two goods in two periods, as well as the quantities consumed by the average family each
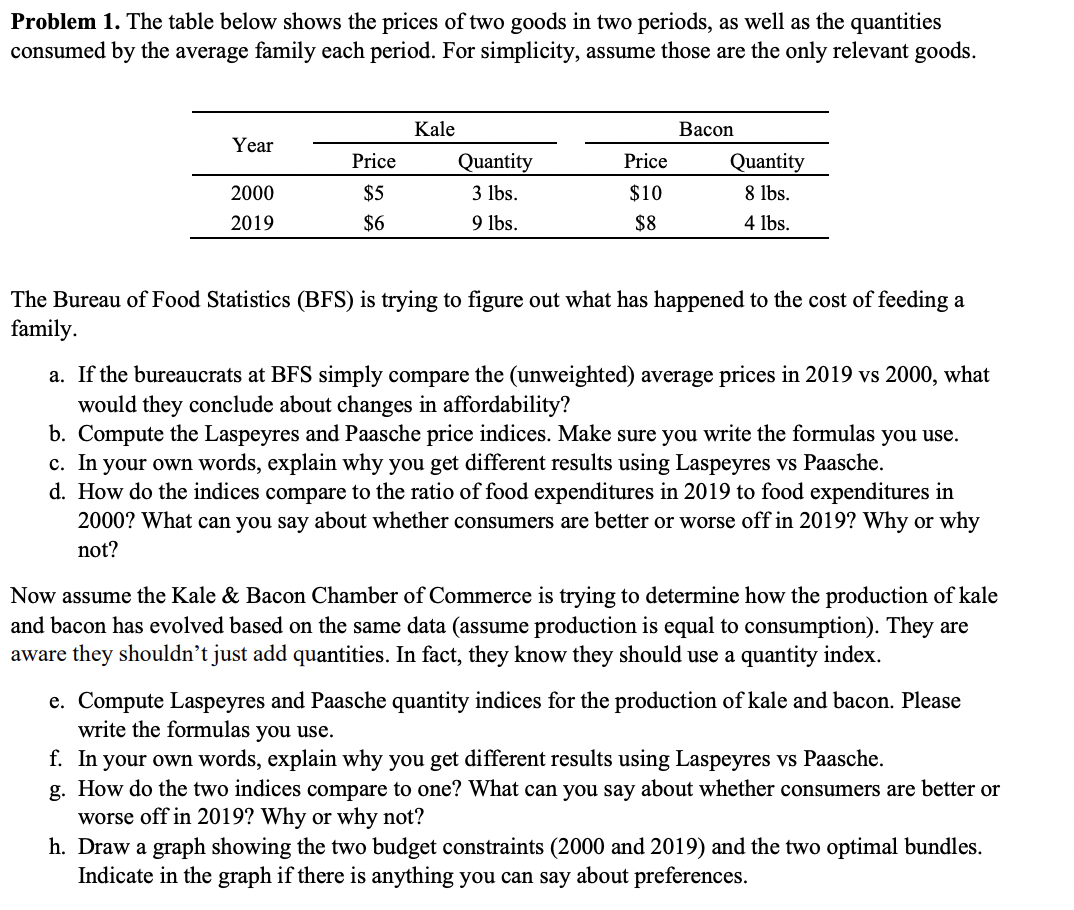
Problem 1. The table below shows the prices of two goods in two periods, as well as the quantities consumed by the average family each period. For simplicity, assume those are the only relevant goods. Kale Bacon Year + + Pr1ce Quannty Price Quantity 2000 $5 3 lbs. $ 10 8 lbs. 2019 $6 9 lbs. $8 4 lbs. The Bureau of Food Statistics (BFS) is trying to gure out what has happened to the cost of feeding a family. a. If the bureaucrats at BFS simply compare the (unweighted) average prices in 2019 vs 2000, what would they conclude about changes in affordability? b. Compute the Laspeyres and Paasche price indices. Make sure you write the formulas you use. 0. In your own words, explain why you get different results using Laspeyres vs Paasche. d. How do the indices compare to the ratio of food expenditures in 2019 to food expenditures in 2000? What can you say about whether consumers are better or worse off in 2019? Why or why not? Now assume the Kale & Bacon Chamber of Commerce is trying to determine how the production of kale and bacon has evolved based on the same data (assume production is equal to consumption). They are aware they shouldn't just add quanties. In fact, they know they should use a quantity index. e. Compute Laspeyres and Paasche quantity indices for the production of kale and bacon. Please w1ite the formulas you use. f. In your own words, explain why you get different results using Laspeyres vs Paasche. g. How do the two indices compare to one? What can you say about whether consumers are better or worse off in 2019? Why or why not? h. Draw a graph showing the two budget constraints (2000 and 2019) and the two optimal bundles. Indicate in the graph if there is anything you can say about preferences
Step by Step Solution
There are 3 Steps involved in it

Get step-by-step solutions from verified subject matter experts