

Question: Problem 1 . Two samples were collected from the embankment of a levee to assess the soils' susceptibility to internal erosion. The results of the
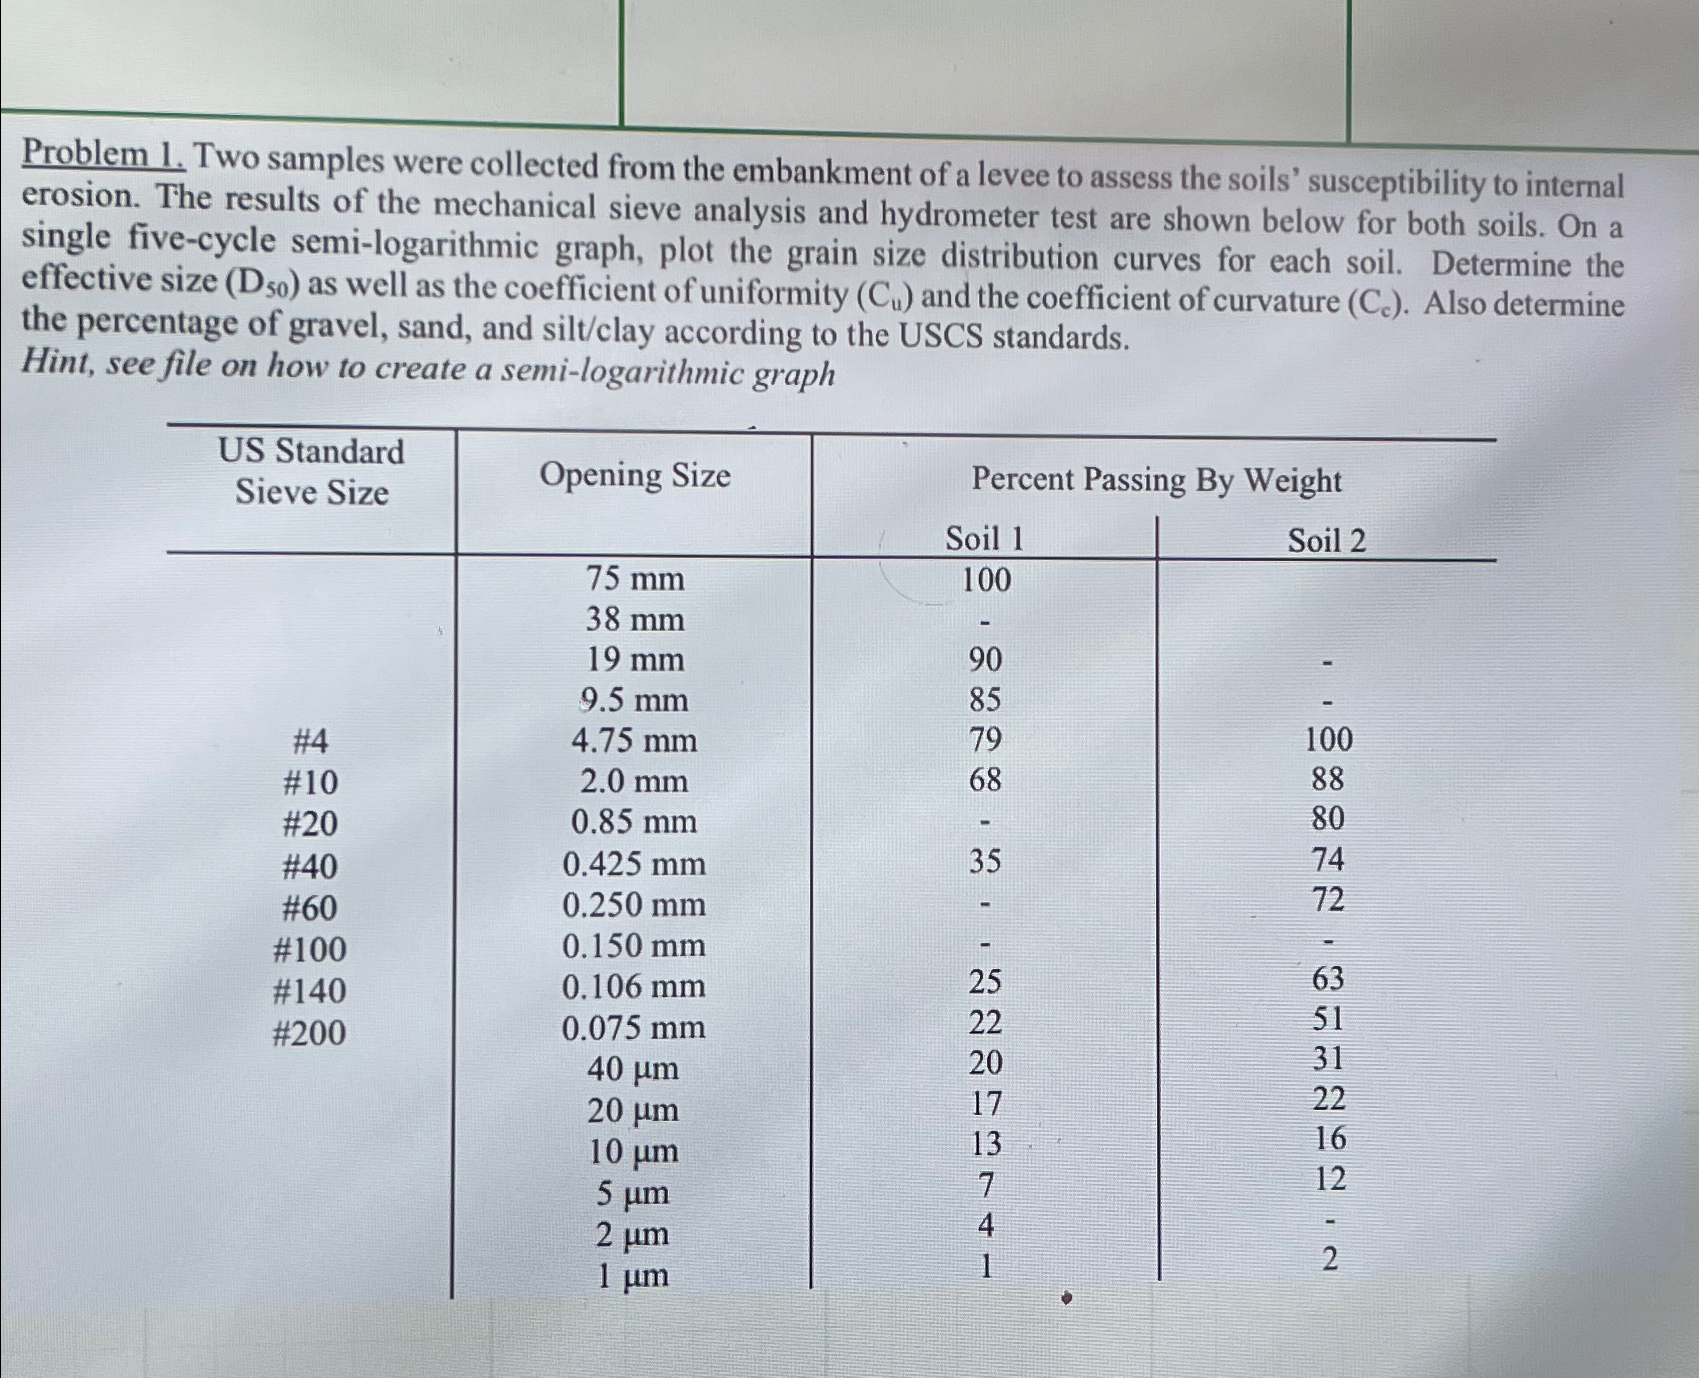
Problem Two samples were collected from the embankment of a levee to assess the soils' susceptibility to internal erosion. The results of the mechanical sieve analysis and hydrometer test are shown below for both soils. On a single fivecycle semilogarithmic graph, plot the grain size distribution curves for each soil. Determine the effective size as well as the coefficient of uniformity and the coefficient of curvature Also determine the percentage of gravel, sand, and siltclay according to the USCS standards.
Hint, see file on how to create a semilogarithmic graph
tabletableUS StandardSieve SizeOpening Size,Percent Passing By WeightSoil Soil ########
Step by Step Solution
There are 3 Steps involved in it
1 Expert Approved Answer
Step: 1 Unlock

Question Has Been Solved by an Expert!
Get step-by-step solutions from verified subject matter experts
Step: 2 Unlock
Step: 3 Unlock