

Question: Problem 1 Using data file TRAFFIC2 run the following model relating totacc to t, tsa, unem, wkends, beltlaw, spdlaw. 1.1. Interpret coefficients on variables unem,
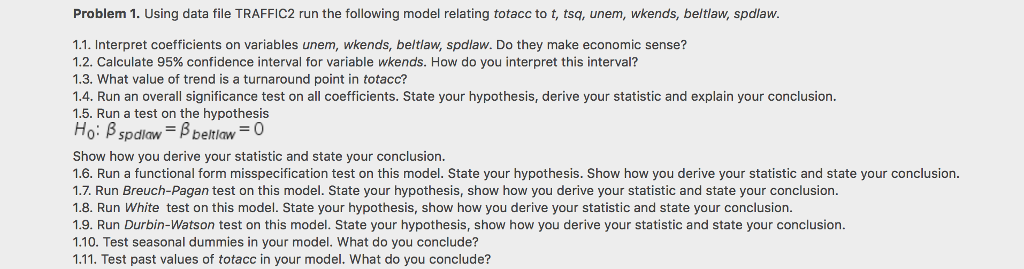
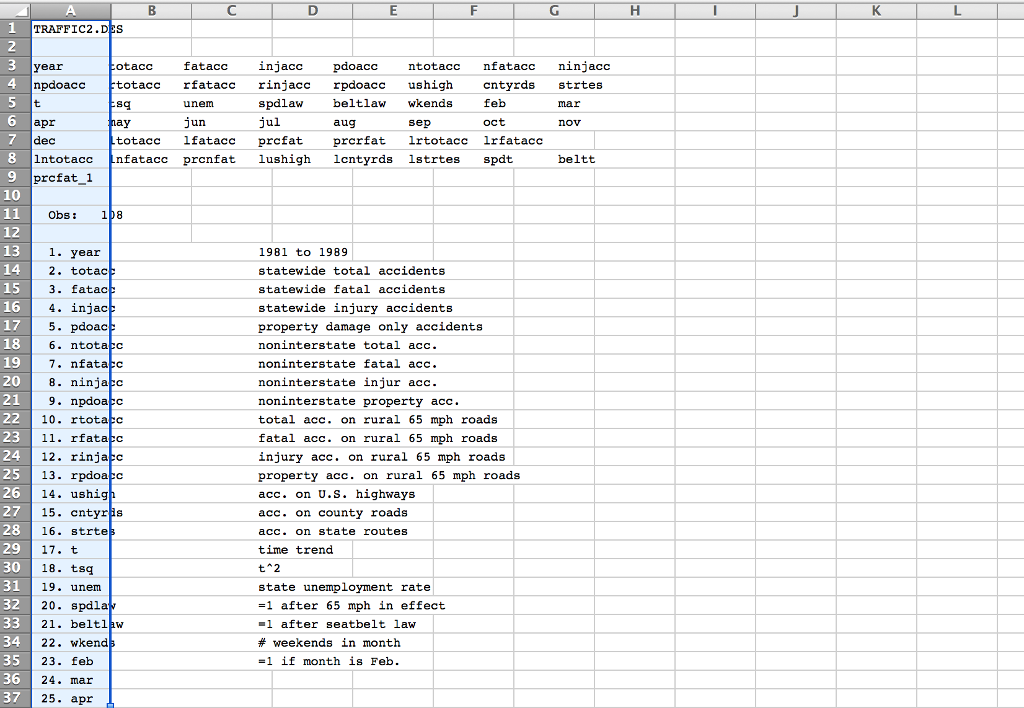
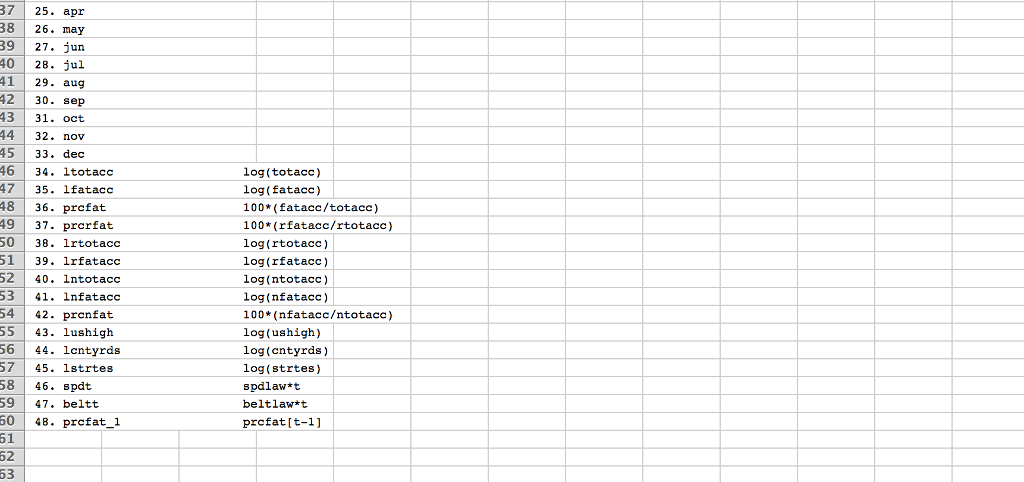
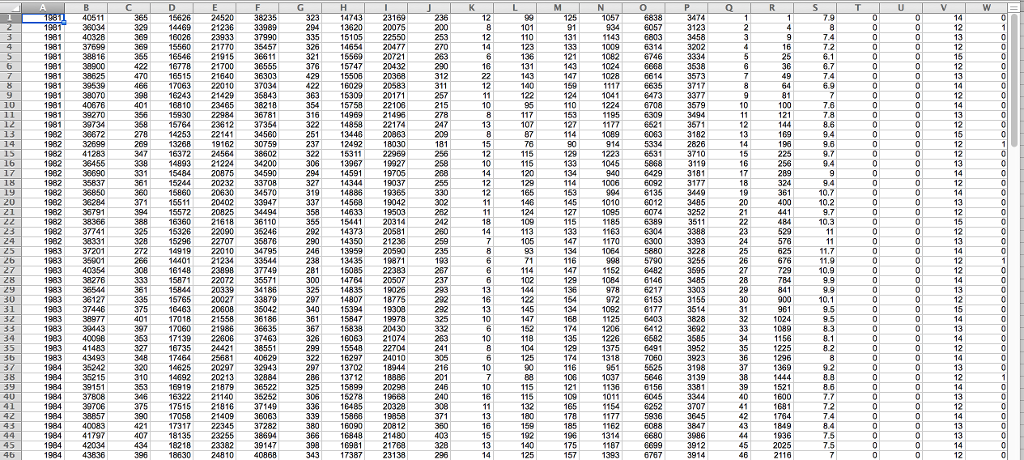
Problem 1 Using data file TRAFFIC2 run the following model relating totacc to t, tsa, unem, wkends, beltlaw, spdlaw. 1.1. Interpret coefficients on variables unem, wkends, beltlaw, spdlaw. Do they make economic sense? 1.2. Calculate 95% confidence interval for variable wkends. How do you interpret this interval? 1.3. What value of trend is a turnaround point in totacc? 1.4. Run an overall significance test on all coefficients. State your hypothesis, derive your statistic and explain your conclusion. 1.5. Run a test on the hypothesis Ho: B sp dlaw beltlaw Show how you derive your statistic and state your conclusion. 1.6. Run a functional form misspecification test on this model. State your hypothesis. Show how you derive your statistic and state your conclusion. 1.7. Run Breuch-Pagan test on this model. State your hypothesis, show how you derive your statistic and state your conclusion. 1.8. Run White test on this model. State your hypothesis, show how you derive your statistic and state your conclusion. 1.9. Run Durbin-Watson test on this model. State your hypothesis, show how you derive your statistic and state your conclusion. 1.10. Test seasonal dummies in your model. What do you conclude? 1.11. Test past values of totacc in your model. What do you conclude? Problem 1 Using data file TRAFFIC2 run the following model relating totacc to t, tsa, unem, wkends, beltlaw, spdlaw. 1.1. Interpret coefficients on variables unem, wkends, beltlaw, spdlaw. Do they make economic sense? 1.2. Calculate 95% confidence interval for variable wkends. How do you interpret this interval? 1.3. What value of trend is a turnaround point in totacc? 1.4. Run an overall significance test on all coefficients. State your hypothesis, derive your statistic and explain your conclusion. 1.5. Run a test on the hypothesis Ho: B sp dlaw beltlaw Show how you derive your statistic and state your conclusion. 1.6. Run a functional form misspecification test on this model. State your hypothesis. Show how you derive your statistic and state your conclusion. 1.7. Run Breuch-Pagan test on this model. State your hypothesis, show how you derive your statistic and state your conclusion. 1.8. Run White test on this model. State your hypothesis, show how you derive your statistic and state your conclusion. 1.9. Run Durbin-Watson test on this model. State your hypothesis, show how you derive your statistic and state your conclusion. 1.10. Test seasonal dummies in your model. What do you conclude? 1.11. Test past values of totacc in your model. What do you conclude
Step by Step Solution
There are 3 Steps involved in it

Get step-by-step solutions from verified subject matter experts