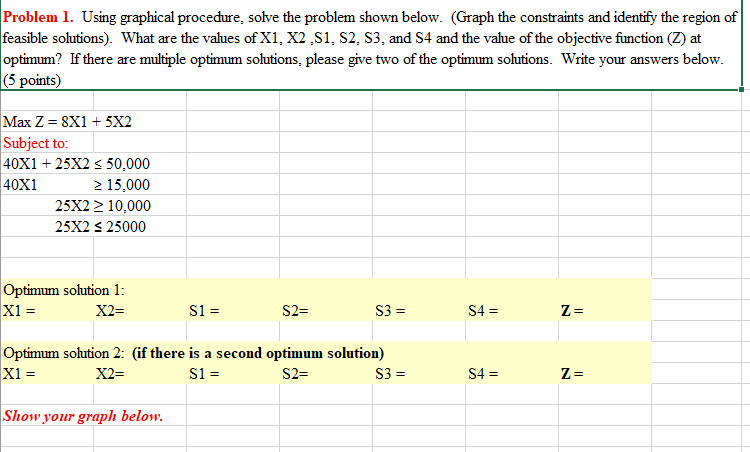
Question: Problem 1. Using graphical procedure, solve the problem shown below. (Graph the constraints and identify the region of feasible solutions). What are the values of

Problem 1. Using graphical procedure, solve the

Problem 1. Using graphical procedure, solve the problem shown below. (Graph the constraints and identify the region of feasible solutions). What are the values of X1, X2,S1, S2, S3, and S4 and the value of the objective function (Z) at optimum? If there are multiple optimum solutions, please give two of the optimum solutions. Write your answers below. (5 points) Max Z= 8X1 + 5X2 Subject to: 40X1 + 25X2 15,000 25X2 > 10,000 25X2 = 25000 Optimum solution 1: X1 = X2= S1 = S2= S3 = S4= Z= Optimum solution 2: (if there is a second optimum solution) X1 = X2= S1 = S2= S3 = S4 = Z= Show your graph below

Step by Step Solution

There are 3 Steps involved in it

1 Expert Approved Answer
Step: 1 Unlock blur-text-image
Question Has Been Solved by an Expert!

Get step-by-step solutions from verified subject matter experts

Step: 2 Unlock
Step: 3 Unlock

Students Have Also Explored These Related General Management Questions!