

Question: PROBLEM 1 (Version A): The sales manager for PopBoys is developing a new lubricant for high-power engines. The product called Fuel Tool is being evaluated
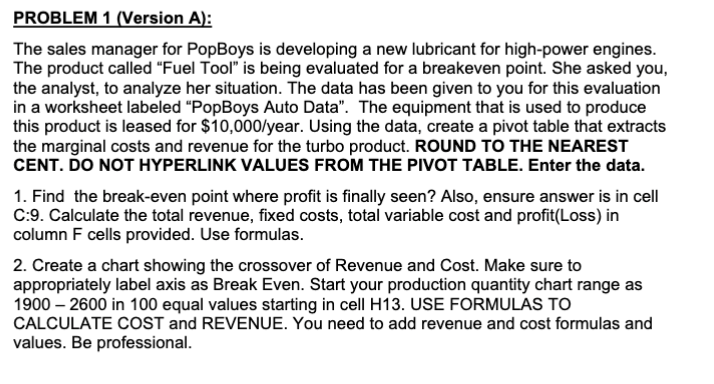
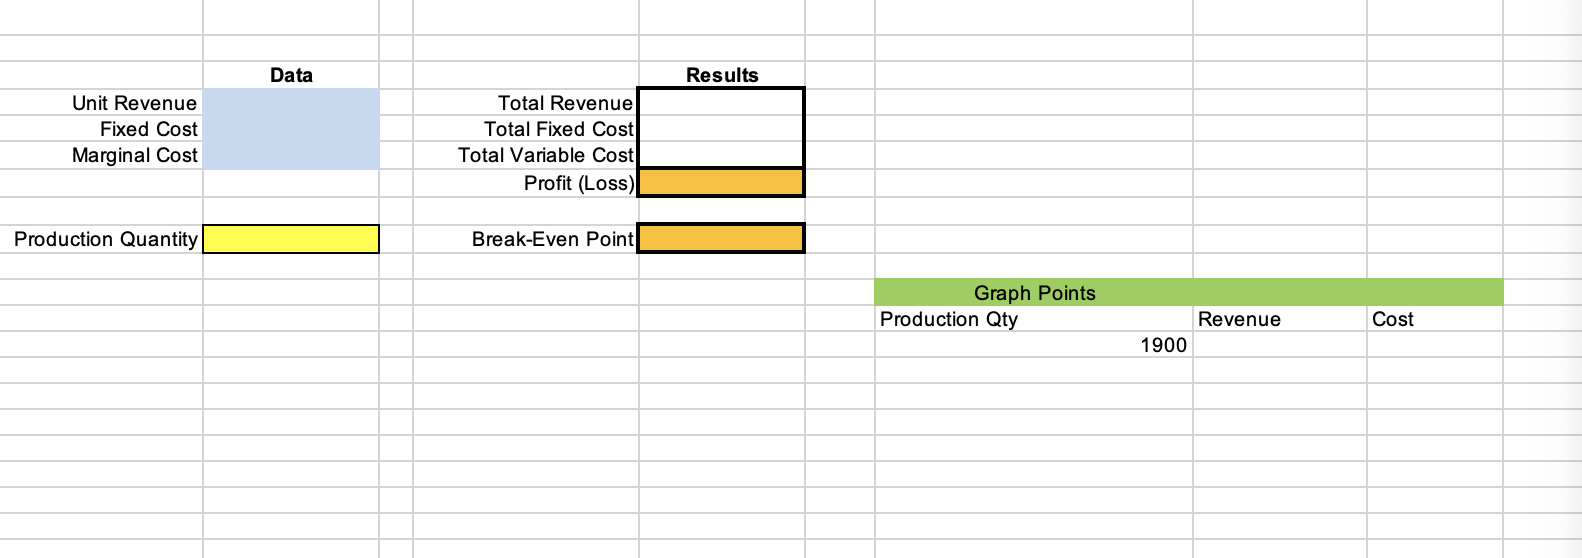
PROBLEM 1 (Version A): The sales manager for PopBoys is developing a new lubricant for high-power engines. The product called "Fuel Tool" is being evaluated for a breakeven point. She asked you, the analyst, to analyze her situation. The data has been given to you for this evaluation in a worksheet labeled "PopBoys Auto Data". The equipment that is used to produce this product is leased for $10,000/ year. Using the data, create a pivot table that extracts the marginal costs and revenue for the turbo product. ROUND TO THE NEAREST CENT. DO NOT HYPERLINK VALUES FROM THE PIVOT TABLE. Enter the data. 1. Find the break-even point where profit is finally seen? Also, ensure answer is in cell C:9. Calculate the total revenue, fixed costs, total variable cost and profit(Loss) in column F cells provided. Use formulas. 2. Create a chart showing the crossover of Revenue and Cost. Make sure to appropriately label axis as Break Even. Start your production quantity chart range as 19002600 in 100 equal values starting in cell H13. USE FORMULAS TO CALCULATE COST and REVENUE. You need to add revenue and cost formulas and values. Be professional
Step by Step Solution
There are 3 Steps involved in it

Get step-by-step solutions from verified subject matter experts