

Question: Problem 1: Weather Problem (30 pts) For these three assignments, data will be provided to you via several publicly accessible endpoints. Some end points might
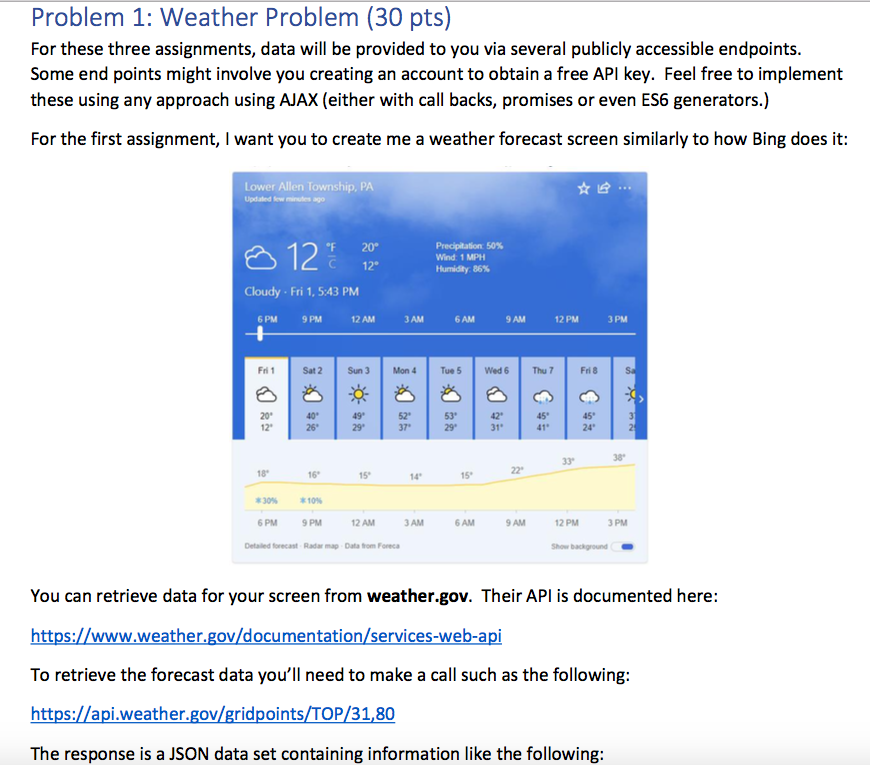
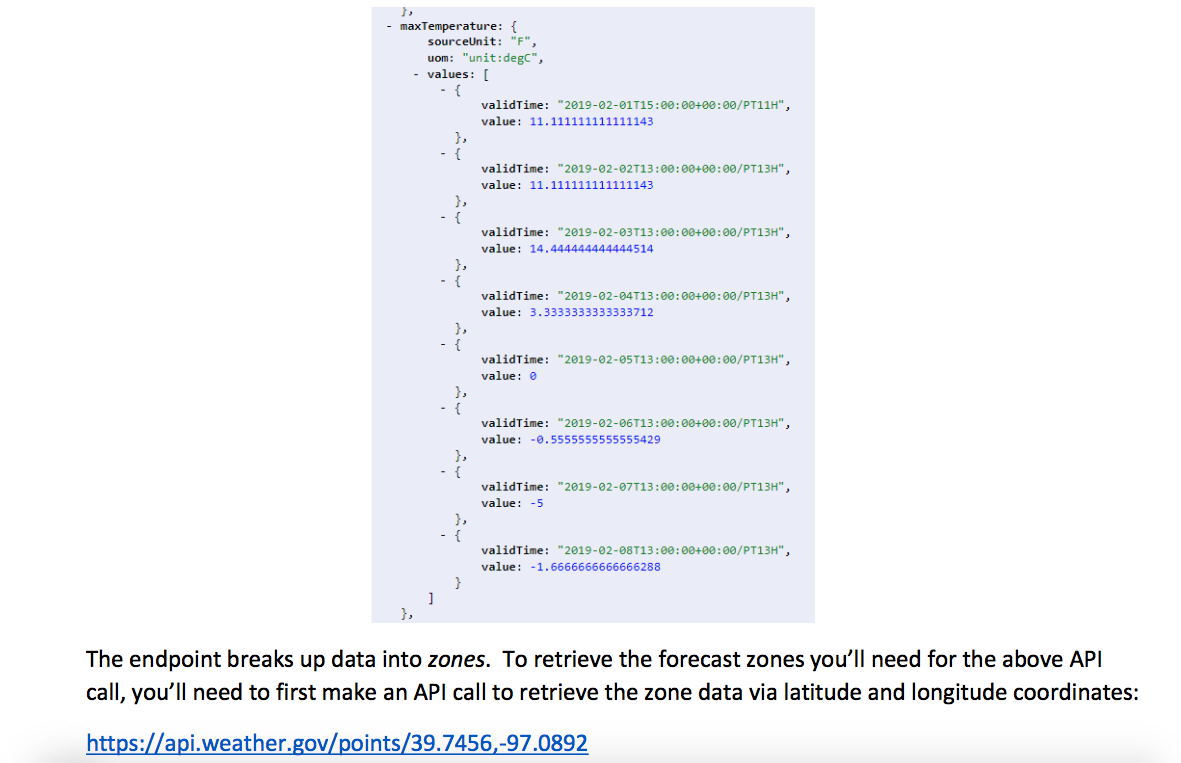
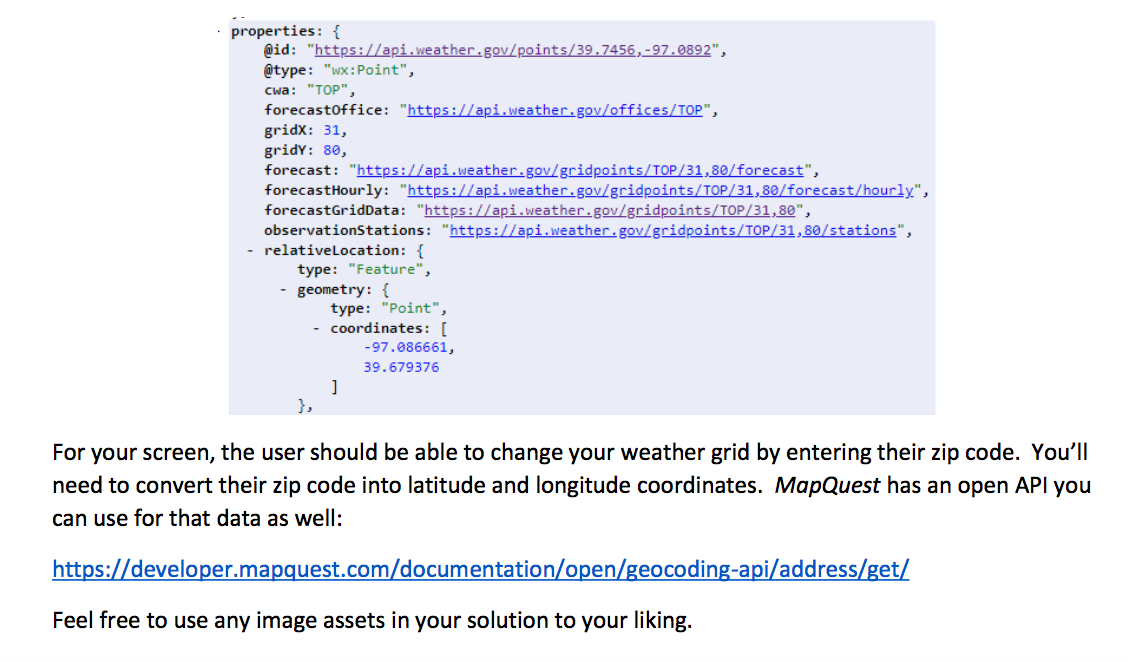
Problem 1: Weather Problem (30 pts) For these three assignments, data will be provided to you via several publicly accessible endpoints. Some end points might involve you creating an account to obtain a free API key. Feel free to implement these using any approach using AJAX (either with call backs, promises or even ES6 generators.) For the first assignment, I want you to create me a weather forecast screen similarly to how Bing does it: Lower Allen Township, PA Updated few minutes ago 20 12" 12 Precipitation: 50% Wind: 1 MPH Humidity 86% Cloudy. Fri 1, 5:43 PM 6 PM 9 PM 12 AM 3 AM 6 AM 9 AM 12 PM 3 PM Fri 1 Sat 2 Sun 3 Mon 4 Tue 5 Wed 6 That Fri 8 SA 20 12 40 25 49 29 52 37 53 29 42 31" 45 41 45 24 2 139 38 18 16 15 14 15 *10% 6 AM 9 AM 6 PM 9 PM 12 AM 3 AM Detailed forecast Radar map Data from Foreca 12 PM 3 PM Show background You can retrieve data for your screen from weather.gov. Their API is documented here: https://www.weather.gov/documentation/services-web-api To retrieve the forecast data you'll need to make a call such as the following: https://api.weather.gov/gridpoints/TOP/31,80 The response is a JSON data set containing information like the following: - maxTemperature: { sourceUnit: "F", uom: "unit:degc", - values: [ validTime: "2019-02-01T15:00:00+00:00/PT11H", value: 11.111111111111143 { validTime: "2019-02-02T13:00:00+00:00/PT13H", value: 11.111111111111143 }, { validTime: "2019-02-03T13:00:00+00:00/PT13H", value: 14.444444444444514 }, { validTime: "2019-02-04T13:00:00+00:00/PT13H", value: 3.3333333333333712 }, -{ validTime: "2019-02-05T13:00:00+00:00/PT13H", value: 0 }, -{ validTime: "2019-02-06T13:00:00+00:00/PT13H", value: -6.5555555555555429 }, validTime: "2019-02-07T13:00:00+00:00/PT13H", value: -5 { validTime: "2019-02-08T13:00:00+00:00/PT13H", value: -1.6666666666666288 ] }, The endpoint breaks up data into zones. To retrieve the forecast zones you'll need for the above API call, you'll need to first make an API call to retrieve the zone data via latitude and longitude coordinates: https://api.weather.gov/points/39.7456,-97.0892 properties: { @id: "https://api.weather.gov/points/39.7456,-97.0892", @type: "wx:Point", cwa: "TOP", forecastoffice: "https://api.weather.gov/offices/TOP", gridx: 31, gridy: 80, forecast: "https://api.weather.gov/gridpoints/TOP/31,80/ forecast", forecastHourly: "https://api.weather.gov/gridpoints/TOP/31,80/forecast/hourly", forecastGridData: "https://api.weather.gov/gridpoints/TOP/31,80", observationStations : "https://api.weather.gov/gridpoints/TOP/31,80/stations", - relativeLocation: { type: "Feature", - geometry: { type: "Point", - coordinates: [ -97.086661, 39.679376 ] }, For your screen, the user should be able to change your weather grid by entering their zip code. You'll need to convert their zip code into latitude and longitude coordinates. MapQuest has an open API you can use for that data as well: https://developer.mapquest.com/documentation/open/geocoding-api/address/get/ Feel free to use any image assets in your solution to your liking. Problem 1: Weather Problem (30 pts) For these three assignments, data will be provided to you via several publicly accessible endpoints. Some end points might involve you creating an account to obtain a free API key. Feel free to implement these using any approach using AJAX (either with call backs, promises or even ES6 generators.) For the first assignment, I want you to create me a weather forecast screen similarly to how Bing does it: Lower Allen Township, PA Updated few minutes ago 20 12" 12 Precipitation: 50% Wind: 1 MPH Humidity 86% Cloudy. Fri 1, 5:43 PM 6 PM 9 PM 12 AM 3 AM 6 AM 9 AM 12 PM 3 PM Fri 1 Sat 2 Sun 3 Mon 4 Tue 5 Wed 6 That Fri 8 SA 20 12 40 25 49 29 52 37 53 29 42 31" 45 41 45 24 2 139 38 18 16 15 14 15 *10% 6 AM 9 AM 6 PM 9 PM 12 AM 3 AM Detailed forecast Radar map Data from Foreca 12 PM 3 PM Show background You can retrieve data for your screen from weather.gov. Their API is documented here: https://www.weather.gov/documentation/services-web-api To retrieve the forecast data you'll need to make a call such as the following: https://api.weather.gov/gridpoints/TOP/31,80 The response is a JSON data set containing information like the following: - maxTemperature: { sourceUnit: "F", uom: "unit:degc", - values: [ validTime: "2019-02-01T15:00:00+00:00/PT11H", value: 11.111111111111143 { validTime: "2019-02-02T13:00:00+00:00/PT13H", value: 11.111111111111143 }, { validTime: "2019-02-03T13:00:00+00:00/PT13H", value: 14.444444444444514 }, { validTime: "2019-02-04T13:00:00+00:00/PT13H", value: 3.3333333333333712 }, -{ validTime: "2019-02-05T13:00:00+00:00/PT13H", value: 0 }, -{ validTime: "2019-02-06T13:00:00+00:00/PT13H", value: -6.5555555555555429 }, validTime: "2019-02-07T13:00:00+00:00/PT13H", value: -5 { validTime: "2019-02-08T13:00:00+00:00/PT13H", value: -1.6666666666666288 ] }, The endpoint breaks up data into zones. To retrieve the forecast zones you'll need for the above API call, you'll need to first make an API call to retrieve the zone data via latitude and longitude coordinates: https://api.weather.gov/points/39.7456,-97.0892 properties: { @id: "https://api.weather.gov/points/39.7456,-97.0892", @type: "wx:Point", cwa: "TOP", forecastoffice: "https://api.weather.gov/offices/TOP", gridx: 31, gridy: 80, forecast: "https://api.weather.gov/gridpoints/TOP/31,80/ forecast", forecastHourly: "https://api.weather.gov/gridpoints/TOP/31,80/forecast/hourly", forecastGridData: "https://api.weather.gov/gridpoints/TOP/31,80", observationStations : "https://api.weather.gov/gridpoints/TOP/31,80/stations", - relativeLocation: { type: "Feature", - geometry: { type: "Point", - coordinates: [ -97.086661, 39.679376 ] }, For your screen, the user should be able to change your weather grid by entering their zip code. You'll need to convert their zip code into latitude and longitude coordinates. MapQuest has an open API you can use for that data as well: https://developer.mapquest.com/documentation/open/geocoding-api/address/get/ Feel free to use any image assets in your solution to your liking
Step by Step Solution
There are 3 Steps involved in it

Get step-by-step solutions from verified subject matter experts