

Question: Problem 1. When John started his freshman year at GWU, his parents decided to make a basket of items that included his spending on major
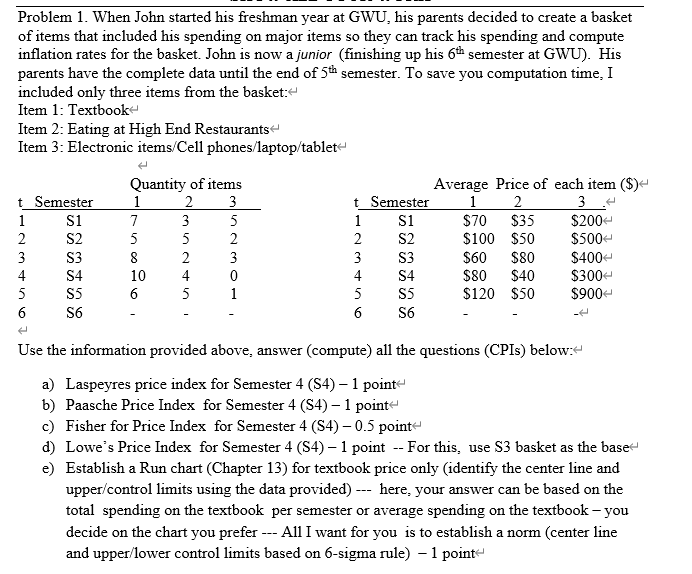
Problem 1. When John started his freshman year at GWU, his parents decided to make a basket of items that included his spending on major items so they can track his spending and compute inflation rates for the basket. John is now a junior (finishing up his 6th semester at GWU).His parents have the complete data until the end of 5th semester. To save you computation time, I included only three items from the basket:
Item 1: Textbook
Item 2: Eating at High End Restaurants
Item 3: Electronic items/Cell phones/laptop/tablet
Quantity of itemsAverage Price of each item ($)
tSemester123 tSemester123.
1S17351S1$70$35$200
2S25522S2$100$50$500
3S38233S3$60$80$400
4S410404S4$80$40$300
5S56515S5$120$50$900
6S6---6S6---
Use the information provided above, answer (compute) all the questions (CPIs) below:
a)Laspeyres price index for Semester 4 (S4)
b)Paasche Price Index for Semester 4 (S4)
c)Fisher for Price Index for Semester 4 (S4)
d)Lowe's Price Index for Semester 4 (S4) -- For this, use S3 basket as the base
e)Establish a Run chart (Chapter 13) for textbook price only (identify the center line and upper/control limits using the data provided) ---here, your answer can be based on the totalspending on the textbookper semester or average spending on the textbook - you decide on the chart you prefer --- All I want for youis to establish a norm (center line and upper/lower control limits based on 6-sigma rule)
Problem 1. When John started his freshman year at GWU, his parents decided to create a basket of items that included his spending on major items so they can track his spending and compute inflation rates for the basket. John is now a junior (finishing up his 6th semester at GWU). His parents have the complete data until the end of 5th semester. To save you computation time, I included only three items from the basket: Item 1: Textbook Item 2: Eating at High End Restaurants Item 3: Electronic items/Cell phones/laptop/tablet Quantity of items Average Price of each item ($)~ Semester 2 t_ Semester 2 3 $1 $70 $35 $200- $2 $2 $100 $50 $500~ $3 8 $3 $60 $80 $400- 10 $80 $40 $300- $5 $5 $120 $50 $900- 56 1 $6 Use the information provided above, answer (compute) all the questions (CPIs) below: a) Laspeyres price index for Semester 4 ($4) - 1 point b) Paasche Price Index for Semester 4 ($4) - 1 point c) Fisher for Price Index for Semester 4 ($4) -0.5 point d) Lowe's Price Index for Semester 4 ($4) - 1 point -- For this, use $3 basket as the based e) Establish a Run chart (Chapter 13) for textbook price only (identify the center line and upper/control limits using the data provided) --- here, your answer can be based on the total spending on the textbook per semester or average spending on the textbook - you decide on the chart you prefer --- All I want for you is to establish a norm (center line and upper/lower control limits based on 6-sigma rule) - 1 point
Step by Step Solution
There are 3 Steps involved in it

Get step-by-step solutions from verified subject matter experts