

Question: Problem 10 Intro The table below shows the expected rates of return for three stocks and their weights in some portfolio: Stock B Stock C
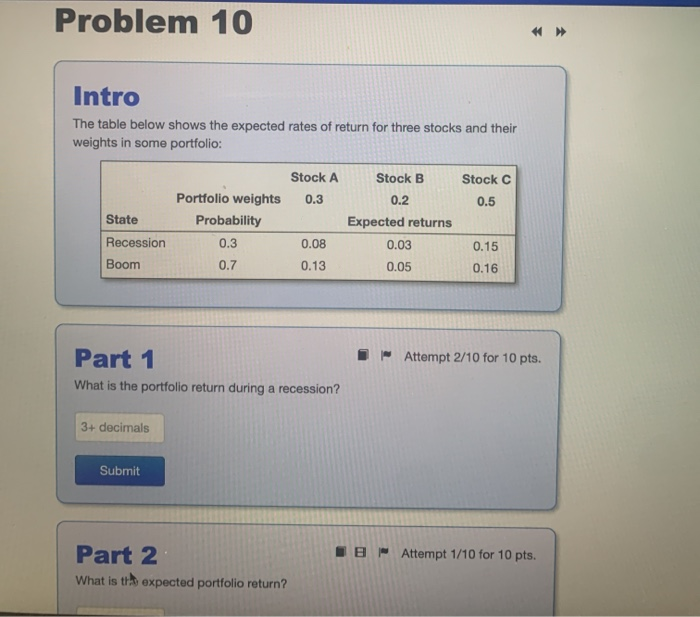
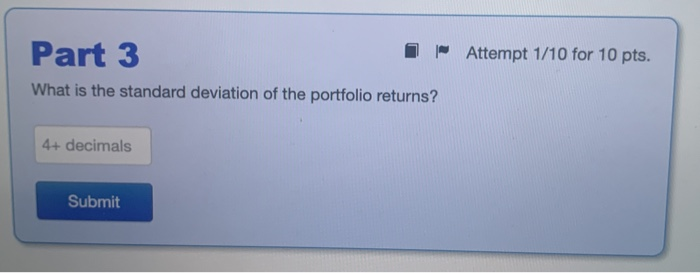
Problem 10 Intro The table below shows the expected rates of return for three stocks and their weights in some portfolio: Stock B Stock C Stock A 0.3 0.2 0.5 State Portfolio weights Probability 0.3 Expected returns Recession 0.08 0.03 0.15 0.16 Boom 0.7 0.13 0.05 - Attempt 2/10 for 10 pts. Part 1 What is the portfolio return during a recession? 3+ decimals Submit IB Attempt 1/10 for 10 pts. Part 2 What is the expected portfolio return? Attempt 1/10 for 10 pts. Part 3 What is the standard deviation of the portfolio returns? 4+ decimals Submit
Step by Step Solution
There are 3 Steps involved in it
1 Expert Approved Answer
Step: 1 Unlock

Question Has Been Solved by an Expert!
Get step-by-step solutions from verified subject matter experts
Step: 2 Unlock
Step: 3 Unlock