

Question: Problem 11-11 Complete the steps below using cell references to given data or previous calculations. In some cases, a simple cell reference is all you
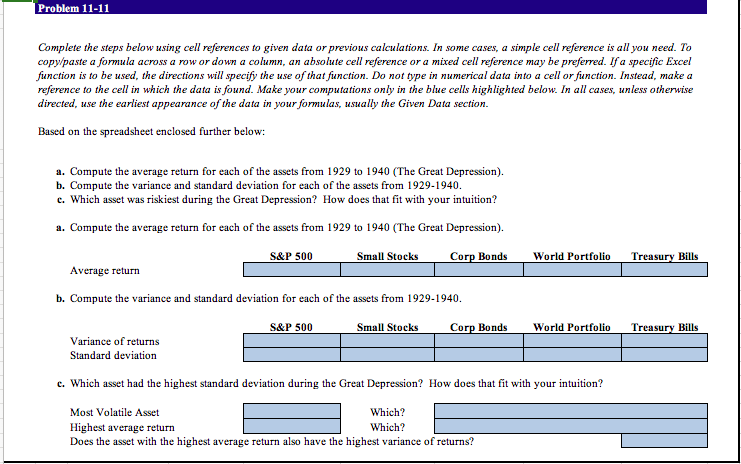
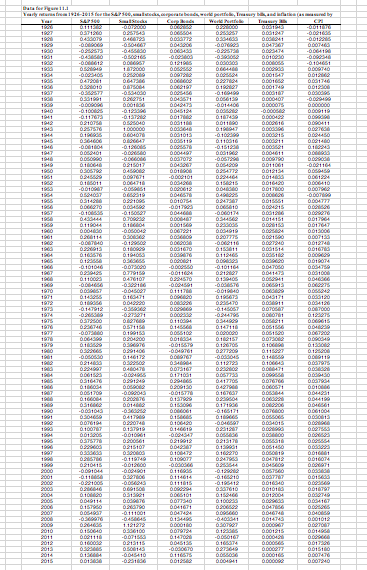
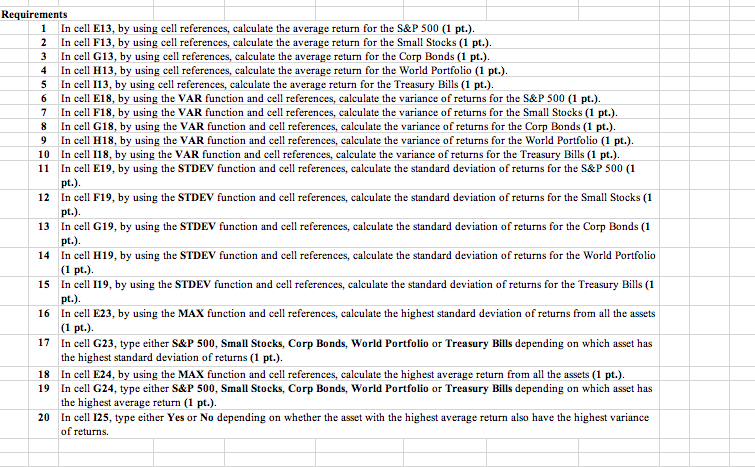
Problem 11-11 Complete the steps below using cell references to given data or previous calculations. In some cases, a simple cell reference is all you need. To cop paste a formula across a row or down a column, an absolute cell reference or a mixed cell reference may be preferred. Ifa specific Excel function is to be used, the directions will specify the use of that function. Do not type in numerical data into a cell or function. Instead, make a reference to the cell in which the data is found. Make your computations only in the blue cells highlighted below. In all cases, unless otherwise directed, use the earliest appearance of the data in yourformulas, usually the Given Data section. Based on the spreadsheet enclosed further below: a. Compute the average return for each of the assets from 1929 to 1940 (The Great Depression) b. Compute the variance and standard deviation for each of the assets from 1929-1940. c. Which asset was riskiest during the Great Depression? How does that fit with your intuition? a. Compute the average return for each of the assets from 1929 to 1940 (The Great Depression) S&P 500 Small Stocks Corp Bonds World Portfolio T Treasury Bills Average return b. Compute the variance and standard deviation for each of the assets from 1929-1940 S&P 500 Small Stocks Corp Bonds World Portfolio Treasury Bills Variance of returns Standard deviation c. Which asset had the highest standard deviation during the Great Depression? How does that fit with your intuition? Most Volatile Asset Highest average return Does the asset with the highest average return also have the highest variance of returns? Which? Which? 1 Requirements In cell E13, by using cell references, calculate the average return for the S&P 500 (1 pt. 2 In cell F13, by using cell references, calculate the average return for the Small Stocks (1 pt. 3 In cell G13, by using cell references, calculate the average return for the Corp Bonds (1 pt. 4 In el H13, by using cell references, calculate the average return for the World Portfolio (1 pt.) 5 In cell 113, by using cell references, calculate the average return for the Treasury Bills (1 pt.). 6 In cell E18, by using the VAR function and cell references, calculate the variance of returns for the S&P 500 (1 pt.). 7 In cell F18, by using the VAR function and cell references, calculate the variance of returns for the Small Stocks (1 pt.) 8 In cell G18, by using the VAR function and cell references, calculate the variance of returns for the Corp Bonds (1 pt.) 9 In ell H18, by using the VAR function and cell references, calculate the variance of returns for the World Portfolio (1 pt.) 10 Inel 118, by using the VAR function and cell references, calculate the variance of returns for the Treasury Bills (1 pt.) 11 In cell E19, by using the STDEV function and cell references, calculate the standard deviation of returns for the S&P 500 (1 12 In cell F19, by using the STDEV function and cell references, calculate the standard deviation of returns for the Small Stocks (1 13 In cell G19, by using the STDEV function and cell references, calculate the standard deviation of returns for the Corp Bonds (1 14 In cel H19, by using the STDEV function and cell references, calculate the standard deviation of returns for the World Portfolio 15 In cell 119, by using the STDEV function and cell references, calculate the standard deviation of returns for the Treasury Bills (1 16 In cell E23, by using the MAX function and cell references, calculate the highest standard deviation of returns from all the assets 17 In cell G23, type either S&P 500, Small Stocks, Corp Bonds, World Portfolio or Treasury Bills depending on which asset has pt.). pt.). pt.). (1 pt.) pt.). (1 pt.) the highest standard deviation of returns (1 pt.) 18 In cell E24, by using the MAX function and cell references, calculate the highest average return from all the assets (1 pt.). 19In cell G24, type either S&P 500, Small Stocks, Corp Bonds, World Portfolio or Treasury Bills depending on which asset has the highest average return (1 pt.). In cell 125, type either Yes or No depending on whether the asset with the highest average return also have the highest variance of returns. 20 Problem 11-11 Complete the steps below using cell references to given data or previous calculations. In some cases, a simple cell reference is all you need. To cop paste a formula across a row or down a column, an absolute cell reference or a mixed cell reference may be preferred. Ifa specific Excel function is to be used, the directions will specify the use of that function. Do not type in numerical data into a cell or function. Instead, make a reference to the cell in which the data is found. Make your computations only in the blue cells highlighted below. In all cases, unless otherwise directed, use the earliest appearance of the data in yourformulas, usually the Given Data section. Based on the spreadsheet enclosed further below: a. Compute the average return for each of the assets from 1929 to 1940 (The Great Depression) b. Compute the variance and standard deviation for each of the assets from 1929-1940. c. Which asset was riskiest during the Great Depression? How does that fit with your intuition? a. Compute the average return for each of the assets from 1929 to 1940 (The Great Depression) S&P 500 Small Stocks Corp Bonds World Portfolio T Treasury Bills Average return b. Compute the variance and standard deviation for each of the assets from 1929-1940 S&P 500 Small Stocks Corp Bonds World Portfolio Treasury Bills Variance of returns Standard deviation c. Which asset had the highest standard deviation during the Great Depression? How does that fit with your intuition? Most Volatile Asset Highest average return Does the asset with the highest average return also have the highest variance of returns? Which? Which? 1 Requirements In cell E13, by using cell references, calculate the average return for the S&P 500 (1 pt. 2 In cell F13, by using cell references, calculate the average return for the Small Stocks (1 pt. 3 In cell G13, by using cell references, calculate the average return for the Corp Bonds (1 pt. 4 In el H13, by using cell references, calculate the average return for the World Portfolio (1 pt.) 5 In cell 113, by using cell references, calculate the average return for the Treasury Bills (1 pt.). 6 In cell E18, by using the VAR function and cell references, calculate the variance of returns for the S&P 500 (1 pt.). 7 In cell F18, by using the VAR function and cell references, calculate the variance of returns for the Small Stocks (1 pt.) 8 In cell G18, by using the VAR function and cell references, calculate the variance of returns for the Corp Bonds (1 pt.) 9 In ell H18, by using the VAR function and cell references, calculate the variance of returns for the World Portfolio (1 pt.) 10 Inel 118, by using the VAR function and cell references, calculate the variance of returns for the Treasury Bills (1 pt.) 11 In cell E19, by using the STDEV function and cell references, calculate the standard deviation of returns for the S&P 500 (1 12 In cell F19, by using the STDEV function and cell references, calculate the standard deviation of returns for the Small Stocks (1 13 In cell G19, by using the STDEV function and cell references, calculate the standard deviation of returns for the Corp Bonds (1 14 In cel H19, by using the STDEV function and cell references, calculate the standard deviation of returns for the World Portfolio 15 In cell 119, by using the STDEV function and cell references, calculate the standard deviation of returns for the Treasury Bills (1 16 In cell E23, by using the MAX function and cell references, calculate the highest standard deviation of returns from all the assets 17 In cell G23, type either S&P 500, Small Stocks, Corp Bonds, World Portfolio or Treasury Bills depending on which asset has pt.). pt.). pt.). (1 pt.) pt.). (1 pt.) the highest standard deviation of returns (1 pt.) 18 In cell E24, by using the MAX function and cell references, calculate the highest average return from all the assets (1 pt.). 19In cell G24, type either S&P 500, Small Stocks, Corp Bonds, World Portfolio or Treasury Bills depending on which asset has the highest average return (1 pt.). In cell 125, type either Yes or No depending on whether the asset with the highest average return also have the highest variance of returns. 20
Step by Step Solution
There are 3 Steps involved in it

Get step-by-step solutions from verified subject matter experts