

Question: Problem 11-13 Ratio analysis-comprehensive problem Presented here are summarized data from the balance sheets and income statements of Wiper, Inc.: WIPER, INC Condensed Balance Sheets
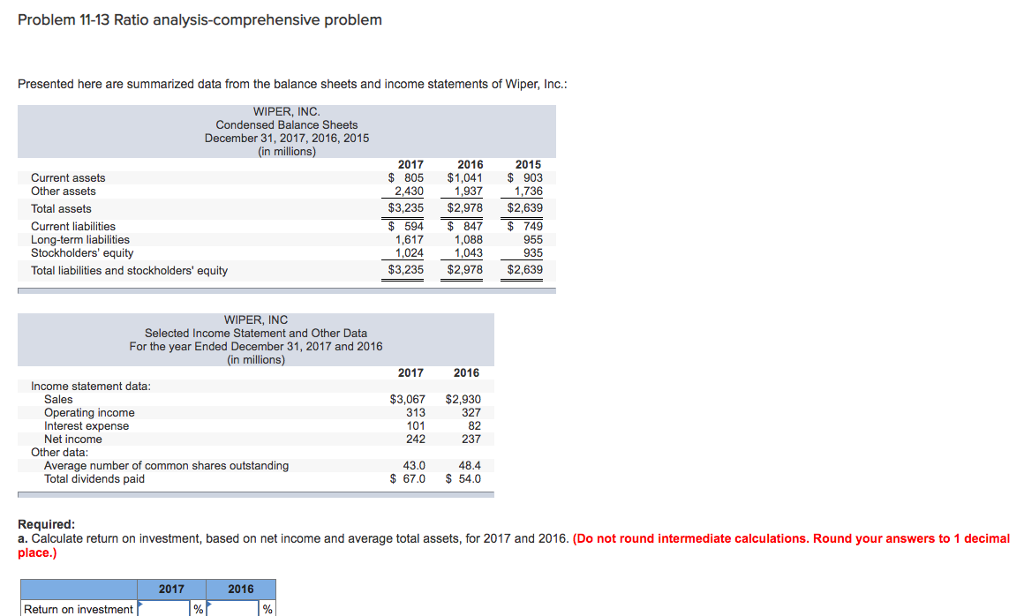
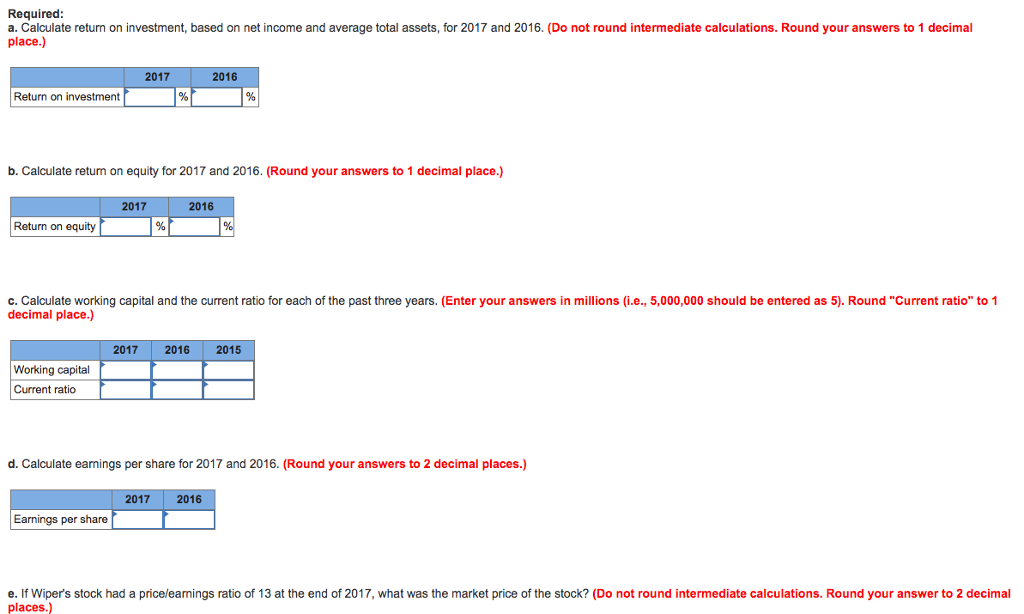
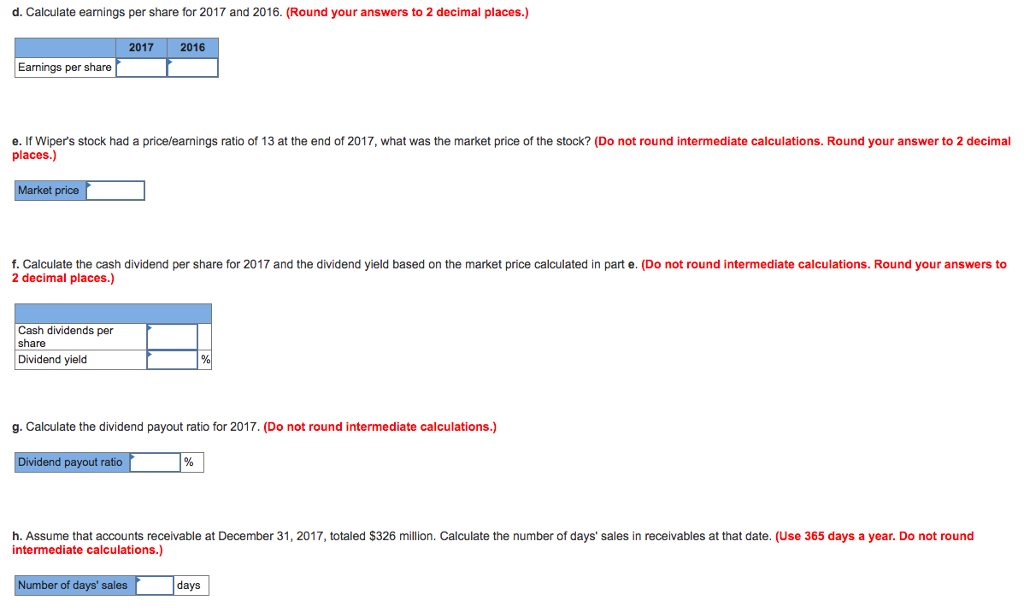
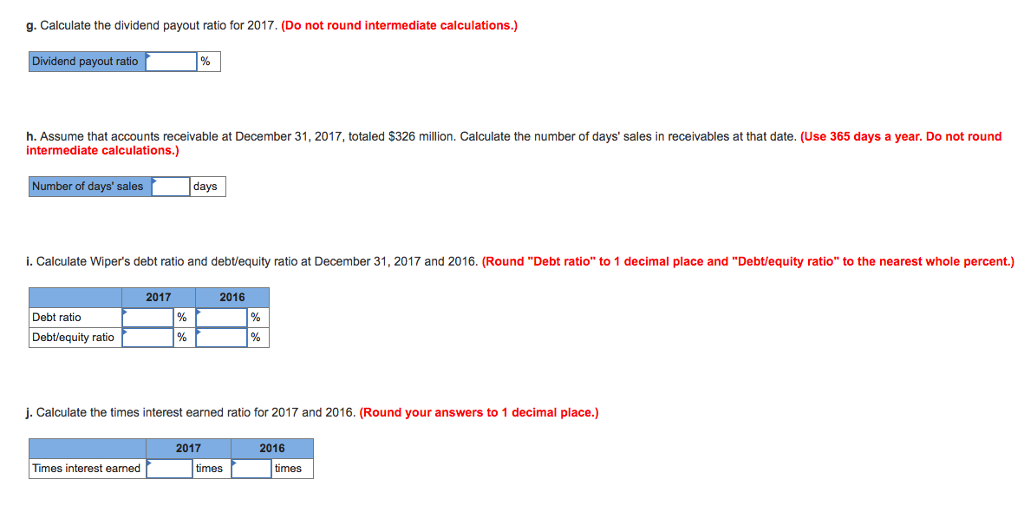
Problem 11-13 Ratio analysis-comprehensive problem Presented here are summarized data from the balance sheets and income statements of Wiper, Inc.: WIPER, INC Condensed Balance Sheets December 31, 2017, 2016, 2015 (in millions) 2015 $ 805$1,041 903 1.9371.730 2017 2016 Current assets Other assets Total assets Current liabilities Long-term liabilities Stockholders' equity Total liabilities and stockholders' equity 2,430 $3.235$2,978 $2,639 $ 594 847 749 955 935 1,617 1,024 1,088 1,043 $3,235 $2,978 $2,639 WIPER, INC Selected Income Statement and Other Data For the year Ended December 31, 2017 and 2016 (in millions) 2017 2016 Income statement data: Sales Operating income Interest expense Net income $3,067 $2,930 327 82 237 313 101 242 Other data Average number of common shares outstanding Total dividends paid 48.4 $ 67.0 S 54.0 43.0 Required a. Calculate return on investment, based on net income and average total assets, for 2017 and 2016. (Do not round intermediate calculations. Round your answers to 1 decimal place.) 2017 2016 Return on investment
Step by Step Solution
There are 3 Steps involved in it

Get step-by-step solutions from verified subject matter experts