

Question: PROBLEM 11.3: Use the ZipGeography and ZipDemography data tables (from dcData) to create these graphics. 1. Make a bar chart showing, for each state, the

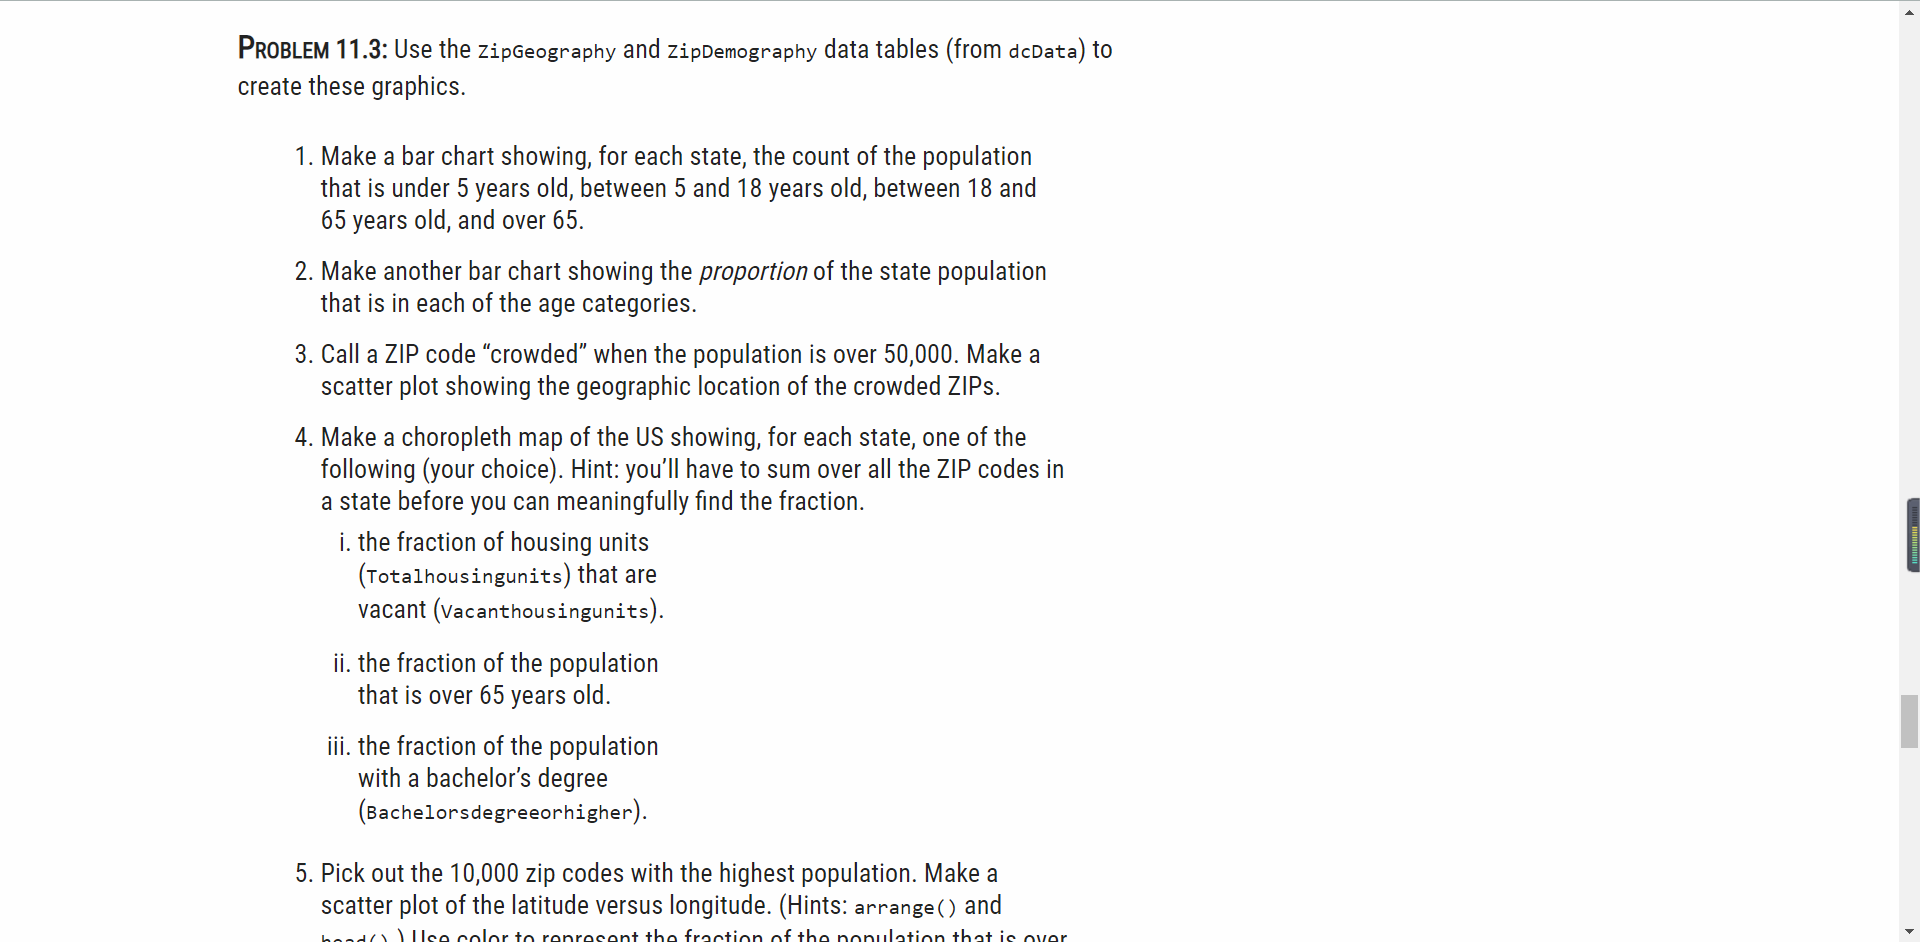
PROBLEM 11.3: Use the ZipGeography and ZipDemography data tables (from dcData) to create these graphics. 1. Make a bar chart showing, for each state, the count of the population that is under 5 years old, between 5 and 18 years old, between 18 and 65 years old, and over 65. 2. Make another bar chart showing the proportion of the state population that is in each of the age categories. 3. Call a ZIP code "crowded" when the population is over 50,000. Make a scatter plot showing the geographic location of the crowded ZIPs. 4. Make a choropleth map of the US showing, for each state, one of the following (your choice). Hint: you'll have to sum over all the ZIP codes in a state before you can meaningfully find the fraction. i. the fraction of housing units (Totalhousingunits) that are vacant (Vacanthousingunits). ii. the fraction of the population that is over 65 years old. iii. the fraction of the population with a bachelor's degree (Bachelorsdegreeorhigher). 5. Pick out the 10,000 zip codes with the highest population. Make a scatter plot of the latitude versus longitude. (Hints: arrange () and
Step by Step Solution
There are 3 Steps involved in it

Get step-by-step solutions from verified subject matter experts