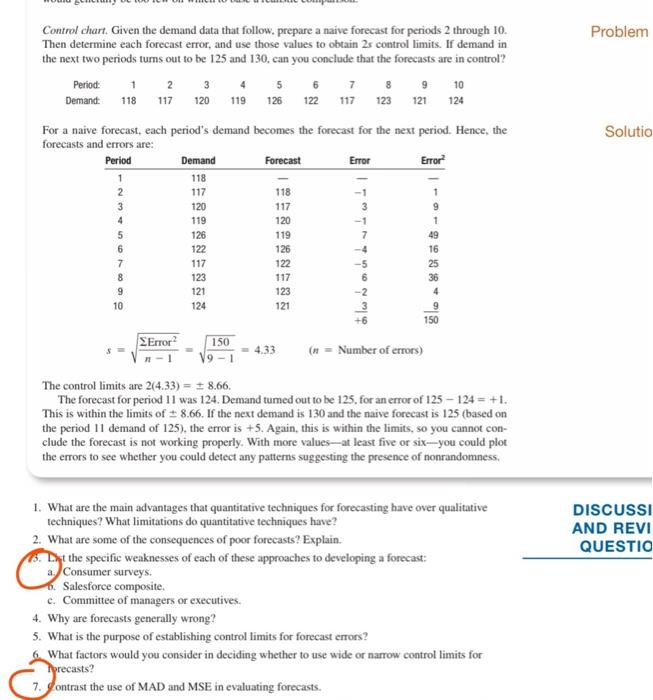
Question: Problem 117 Solutio Control chart. Given the demand data that follow. prepare a naive forecast for periods 2 through 10. Then determine each forecast error,

Problem 117 Solutio Control chart. Given the
Problem 117 Solutio Control chart. Given the demand data that follow. prepare a naive forecast for periods 2 through 10. Then determine each forecast error, and use those values to obtain 2s control limits. If demand in the next two periods turns out to be 125 and 130, can you conclude that the forecasts are in control? Period: 1 2 10 Demand. 118 120 119 126 122 117 123 121 124 For a naive forecast, each period's demand becomes the forecast for the next period. Hence, the forecasts and errors are: Period Demand Forecast Error Error 1 118 117 1 3 120 119 1 5 6 122 126 7 117 122 8 123 117 9 121 123 10 124 121 150 Error? 150 4.33 (1 = Number of errors) 118 117 9 4 120 126 119 to w nor on twill 49 16 25 36 4 The control limits are 2(4.33) = 1 8.66. The forecast for period 11 was 124. Demand tumed out to be 125. for an error of 125 - 124 = +1. This is within the limits of +8.66. If the next demand is 130 and the naive forecast is 125 (based on the period 11 demand of 125). the error is +5. Again, this is within the limits, so you cannot com- clude the forecast is not working properly. With more values at least five or six---you could plot the errors to see whether you could detect any patterns suggesting the presence of nonrandomness. DISCUSSI AND REVI QUESTIO 1. What are the main advantages that quantitative techniques for forecasting have over qualitative techniques? What limitations do quantitative techniques have? 2. What are some of the consequences of poor forecasts? Explain. 13.yt the specific weaknesses of each of these approaches to developing a forecast: a. Consumer surveys 1. Salesforce composite. c. Committee of managers or executives. 4. Why are forecasts generally wrong? 5. What is the purpose of establishing control limits for forecast errors? 6. What factors would you consider in deciding whether to use wide or narrow control limits for Tyrecasts? 7. Jontrast the use of MAD and MSE in evaluating forecasts

Step by Step Solution

There are 3 Steps involved in it

1 Expert Approved Answer
Step: 1 Unlock blur-text-image
Question Has Been Solved by an Expert!

Get step-by-step solutions from verified subject matter experts

Step: 2 Unlock
Step: 3 Unlock

Students Have Also Explored These Related General Management Questions!