

Question: Problem 13 Intro The table below shows the expected rates of return for three stocks and their weights in some portfolio: Part 1 B Attempt
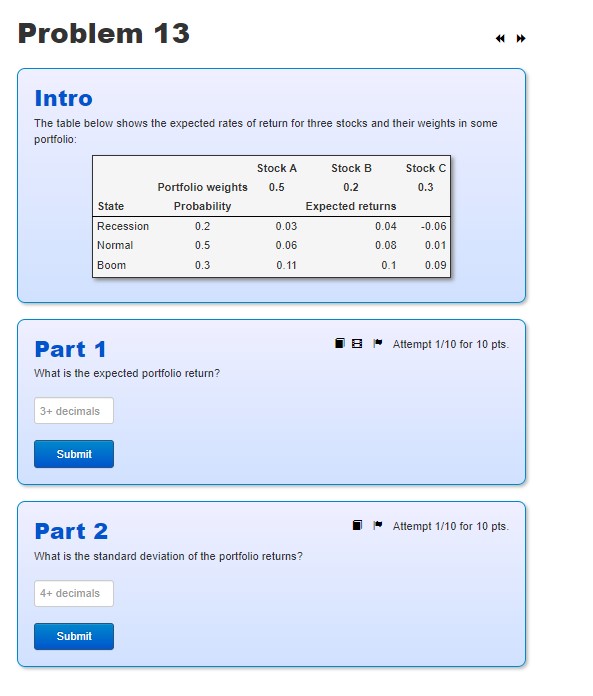
Problem 13 Intro The table below shows the expected rates of return for three stocks and their weights in some portfolio: Part 1 B Attempt 1/10 for 10 pts. What is the expected portfolio return? Part 2 Attempt 1/10 for 10 pts. What is the standard deviation of the portfolio returns
Step by Step Solution
There are 3 Steps involved in it
1 Expert Approved Answer
Step: 1 Unlock

Question Has Been Solved by an Expert!
Get step-by-step solutions from verified subject matter experts
Step: 2 Unlock
Step: 3 Unlock