

Question: Problem 13-3A Condensed balance sheet and income statement data for Pronghorn Corporation are presented here PRONGHORN CORPORATION Balance Sheets December 31 2017 2016 2015 32,000
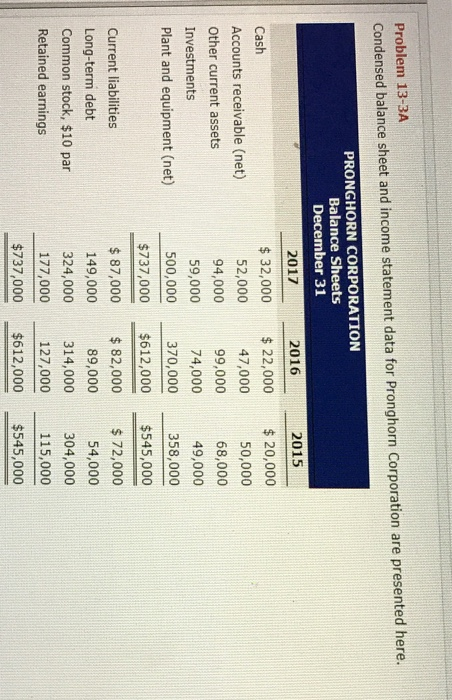
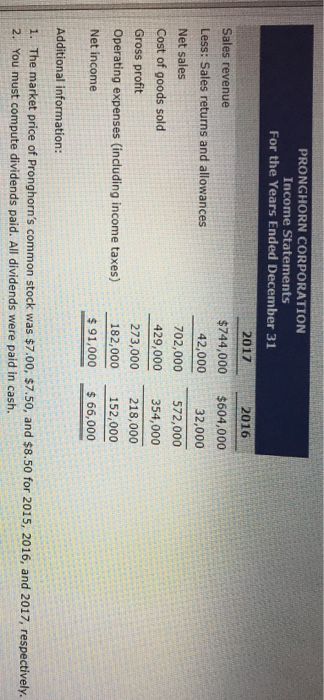
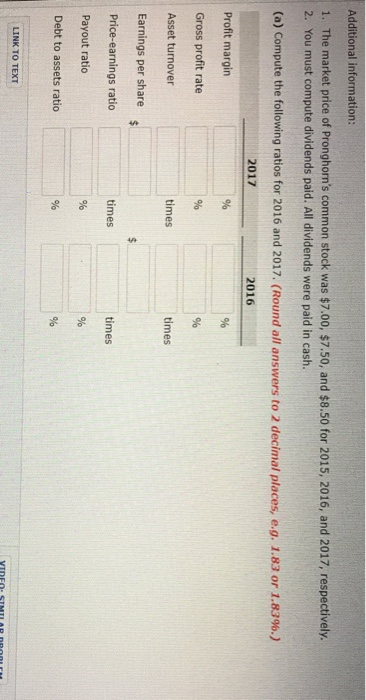
Problem 13-3A Condensed balance sheet and income statement data for Pronghorn Corporation are presented here PRONGHORN CORPORATION Balance Sheets December 31 2017 2016 2015 32,000 22,000 20,000 50,000 68,000 49,000 500,000 370,000 358,000 $737,000 $612,000 $545,000 $ 87,000 82,000 72,000 54,000 324,000 314,000 304,000 177,000 127,000 115,000 $737,000 $612,000 $545,000 Cash Accounts receivable (net) Other current assets Investments Plant and equipment (net) 52,000 94,000 59,000 47,000 99,000 74,000 Current liabilities Long-term debt Common stock, $10 par Retained earnings 149,000 89,000 PRONGHORN CORPORATION Income Statements For the Years Ended December 31 2017 2016 Sales revenue $744,000 $604,000 42,000 32,000 702,000 572,000 429,000 354,000 273,000 218,000 Operating expenses (including income taxes) 182,000 152,000 $ 91,000 66,000 Less: Sales returns and allowances Net sales Cost of goods sold Gross profit Net income Additional information: 1. The market price of Pronghorn's common stock was $7.00, $7.50, and $8.50 for 2015, 2016, and 2017, respectively. 2. You must compute dividends paid. All dividends were paid in cash. Additional information: 1. The market price of Pronghorn's common stock was $7.00, $7.50, and $8.50 for 2015, 2016, and 2017, respectively 2. You must compute dividends paid. All dividends were paid in cash. | (a) Compute the following ratios for 2016 and 2017, (Round all answers to 2 decimal places, e.g. 1.83 or 1.83%.) 2017 2016 Profit margin Gross profit rate Asset turnover Earnings per share Price-earnings ratio Payout ratio Debt to assets ratio times times times times LINK TO TEXT
Step by Step Solution
There are 3 Steps involved in it

Get step-by-step solutions from verified subject matter experts