

Question: Problem 14) Create and provide an x-bar and r-chart for the data set given. Plot your statistical control (SPC) results and explain the trends. Please
Problem 14) Create and provide an x-bar and r-chart for the data set given. Plot your statistical control (SPC) results and explain the trends. Please do all work in Excel and provide all Excel steps with images.
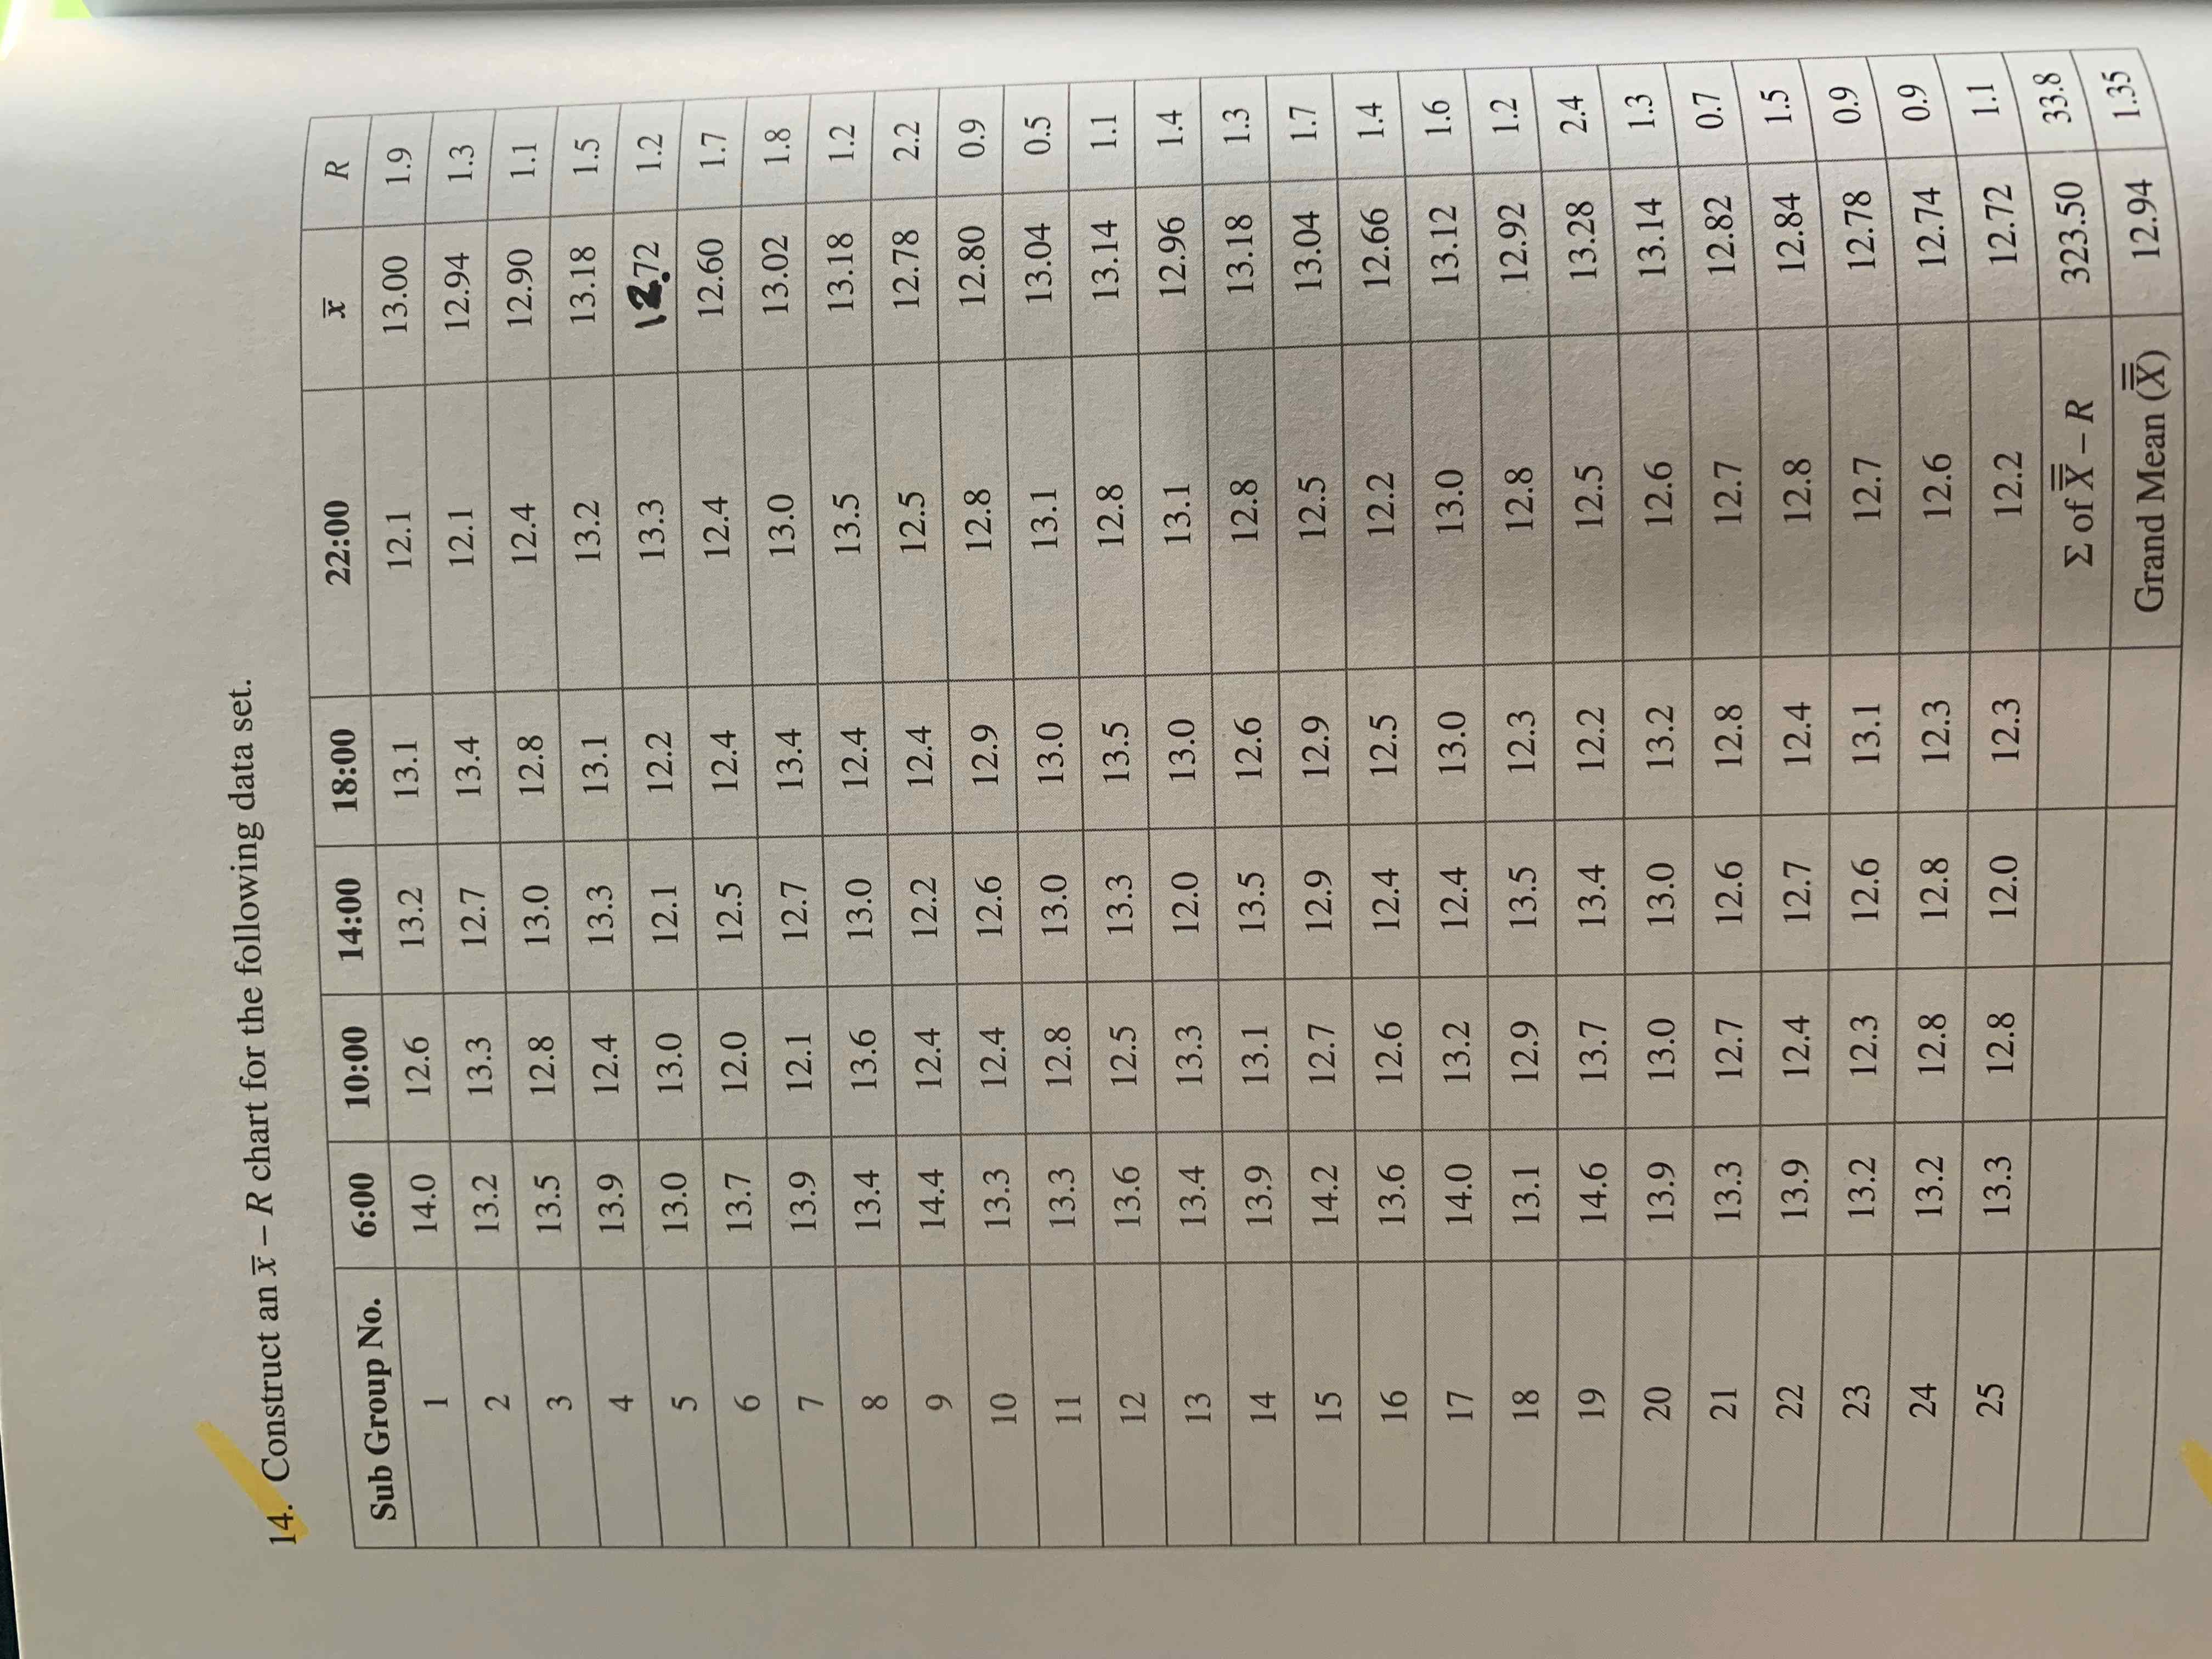
14. Construct an xR chart for the following data set
Step by Step Solution
There are 3 Steps involved in it
1 Expert Approved Answer
Step: 1 Unlock

Question Has Been Solved by an Expert!
Get step-by-step solutions from verified subject matter experts
Step: 2 Unlock
Step: 3 Unlock