

Question: Problem 14-1A (Part Level Submission) Comparative statement data for Farris Company and Ratzlaff Company, two competitors, appear below. All balance sheet data are as of
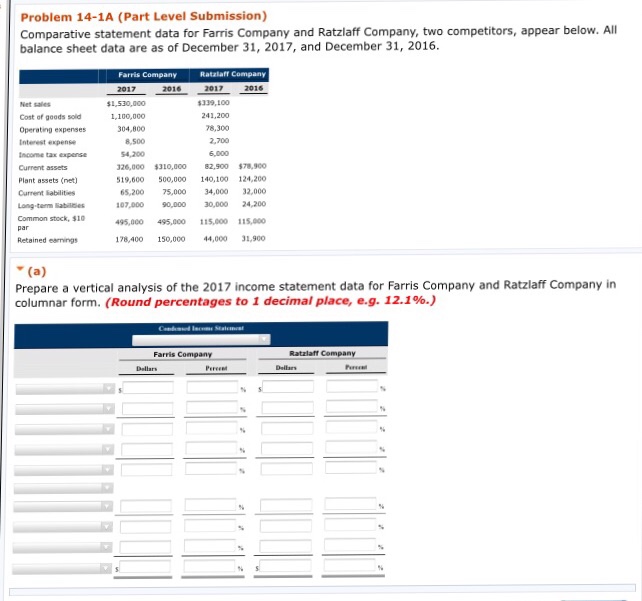
Problem 14-1A (Part Level Submission) Comparative statement data for Farris Company and Ratzlaff Company, two competitors, appear below. All balance sheet data are as of December 31, 2017, and December 31, 2016 Farris Company Ratalaff Company 2017 1 530,00o 1,100,000 304,800 339,100 241,200 8,300 2,700 6,000 Cost of goods sold Operating expenses Interest expense Income tax expense Current assets Plant assets (net Current iabilities Long-term Eabiibes Common stock, $10 8,500 4,200 126,000 $310,000 82,900 $78,900 19,600 500,000 140,100 124,200 65,200 75,000 34,000 32,000 07,0000,000 30,000 24,200 495,000 495,000 115,800 115,000 178,400 150,000 44,000 31,900 Retained earnings Prepare a vertical analysis of the 2017 income statement data for Farris Company and Ratzlaff Company in columnar form. (Round percentages to 1 decimal place, eg. 12.196.)
Step by Step Solution
There are 3 Steps involved in it

Get step-by-step solutions from verified subject matter experts