

Question: Problem 2 (14 marks) Using the following excel spreadsheet (the spreadsheet is incorporated in the word document) complete the ratios for Halifax Super Computers Inc.
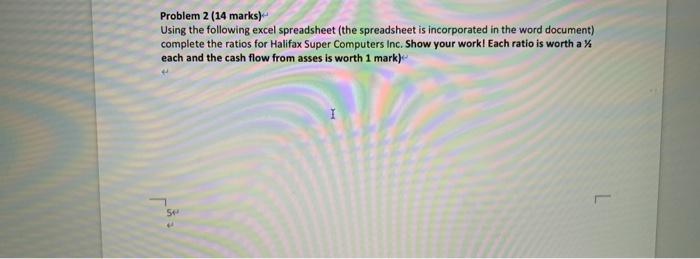
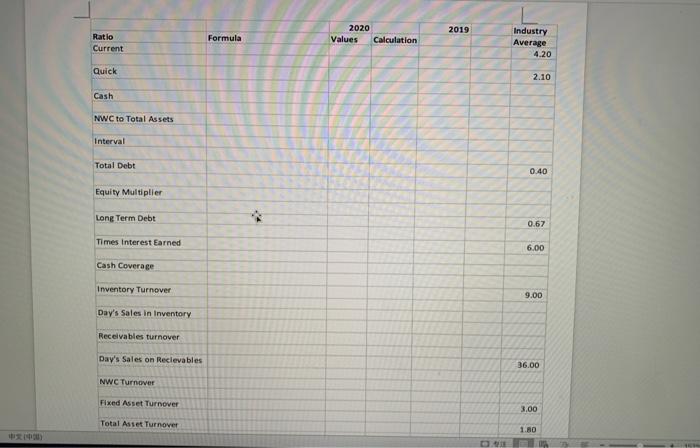
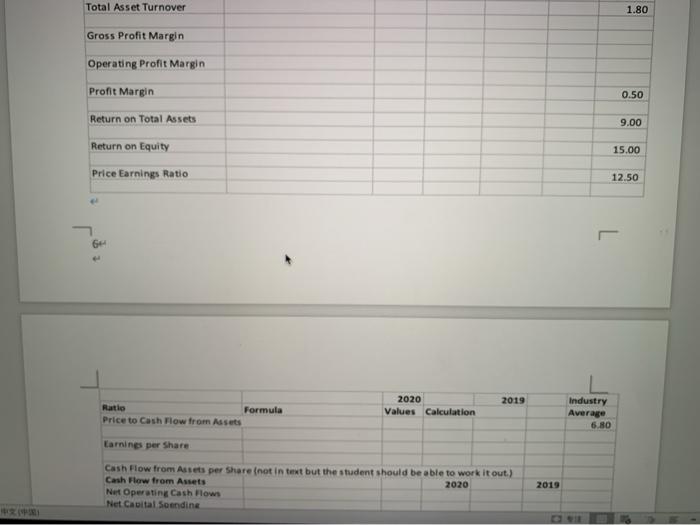
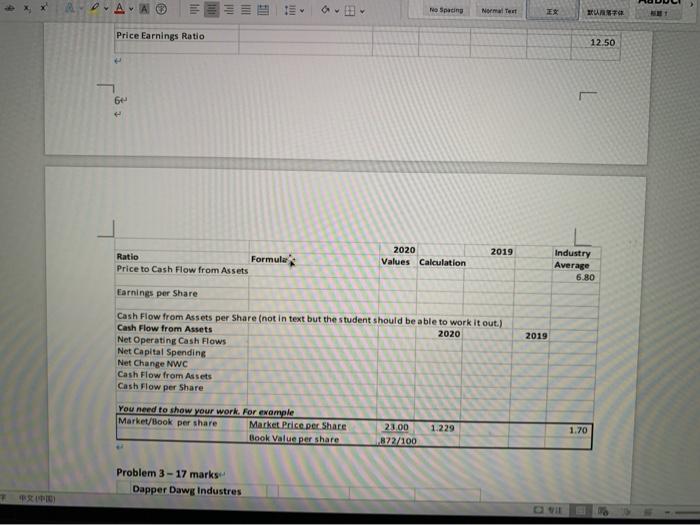
Problem 2 (14 marks) Using the following excel spreadsheet (the spreadsheet is incorporated in the word document) complete the ratios for Halifax Super Computers Inc. Show your work! Each ratio is worth a % each and the cash flow from asses is worth 1 mark) Se 2019 Formula Ratio Current 2020 Values Calculation Industry Average 4.20 Quick 2.10 Cash NWC to Total Assets Interval Total Debt 0.40 Equity Multiplier Long Term Debt 0.67 Times Interest Earned 6.00 Cash Coverage Inventory Turnover 9.00 Day's Sales In Inventory Receivables turnover Day's Sales on Recievables 36.00 NWC Turnover Fixed Asset Turnover 3.00 Total Asset Turnover 1.80 Total Asset Turnover 1.80 Gross Profit Margin Operating Profit Margin Profit Margin 0.50 Return on Total Assets 9.00 Return on Equity 15.00 Price Earnings Ratio 12.50 2019 Ratio Formula Price to Cash Flow from Assets 2020 Values Calculation Industry Average 6.80 Earnings per Share Cash Flow from Assets per Share (not in text but the student should be able to work it out) Cash Flow from Assets 2020 Net Operating Cash Flows Net Cauital Scending 2019 RAA No Spacing Normal Test ES Price Earnings Ratio 12.50 6 2020 Values Calculation Ratio Formule Price to Cash Flow from Assets 2019 Industry Average 6.80 Earnings per Share 2019 Cash Flow from Assets per Share (not in text but the student should be able to work it out.) Cash Flow from Assets 2020 Net Operating Cash Flows Net Capital Spending Net Change NWC Cash Flow from Assets Cash Flow per Share You need to show your work. For example Market/Book per share Market Price per Share Book Value per share 1.229 23.00 1872/100 1.70 Problem 3-17 marks Dapper Dawg Industres Problem 2 (14 marks) Using the following excel spreadsheet (the spreadsheet is incorporated in the word document) complete the ratios for Halifax Super Computers Inc. Show your work! Each ratio is worth a % each and the cash flow from asses is worth 1 mark) Se 2019 Formula Ratio Current 2020 Values Calculation Industry Average 4.20 Quick 2.10 Cash NWC to Total Assets Interval Total Debt 0.40 Equity Multiplier Long Term Debt 0.67 Times Interest Earned 6.00 Cash Coverage Inventory Turnover 9.00 Day's Sales In Inventory Receivables turnover Day's Sales on Recievables 36.00 NWC Turnover Fixed Asset Turnover 3.00 Total Asset Turnover 1.80 Total Asset Turnover 1.80 Gross Profit Margin Operating Profit Margin Profit Margin 0.50 Return on Total Assets 9.00 Return on Equity 15.00 Price Earnings Ratio 12.50 2019 Ratio Formula Price to Cash Flow from Assets 2020 Values Calculation Industry Average 6.80 Earnings per Share Cash Flow from Assets per Share (not in text but the student should be able to work it out) Cash Flow from Assets 2020 Net Operating Cash Flows Net Cauital Scending 2019 RAA No Spacing Normal Test ES Price Earnings Ratio 12.50 6 2020 Values Calculation Ratio Formule Price to Cash Flow from Assets 2019 Industry Average 6.80 Earnings per Share 2019 Cash Flow from Assets per Share (not in text but the student should be able to work it out.) Cash Flow from Assets 2020 Net Operating Cash Flows Net Capital Spending Net Change NWC Cash Flow from Assets Cash Flow per Share You need to show your work. For example Market/Book per share Market Price per Share Book Value per share 1.229 23.00 1872/100 1.70 Problem 3-17 marks Dapper Dawg Industres
Step by Step Solution
There are 3 Steps involved in it

Get step-by-step solutions from verified subject matter experts