

Question: Using the following excel spreadsheet (the spreadsheet is incorporated in the word document) complete the ratios for Halifax Super Computers Inc. 2019 5,700.0 3,534.0 2,166.0
Using the following excel spreadsheet (the spreadsheet is incorporated in the word document) complete the ratios for Halifax Super Computers Inc.
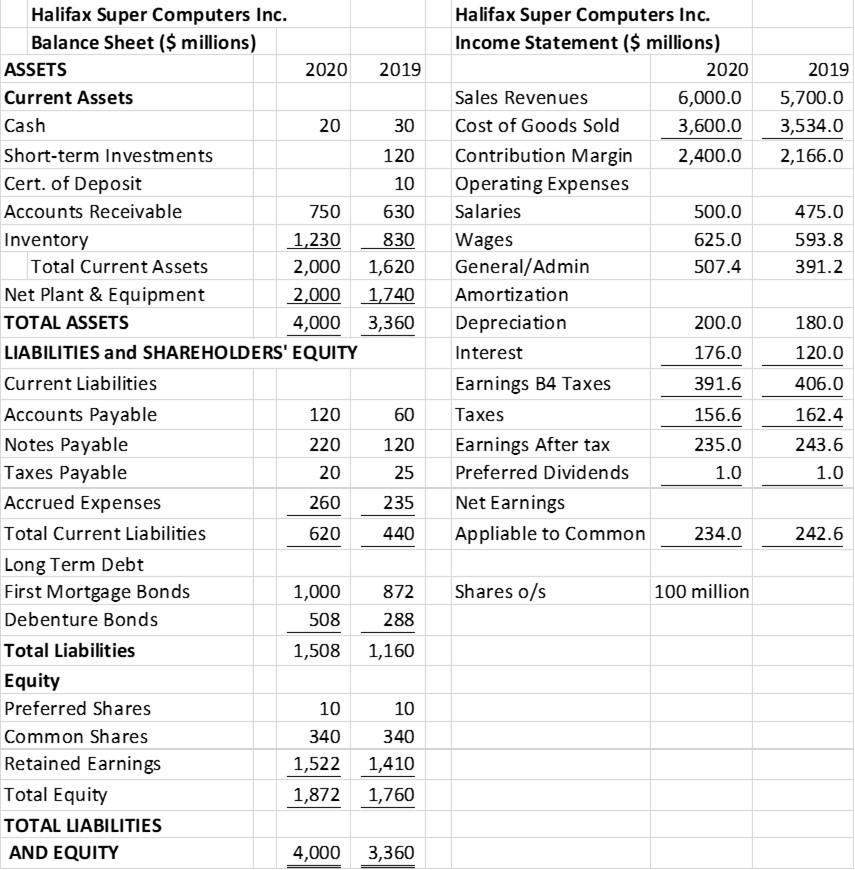
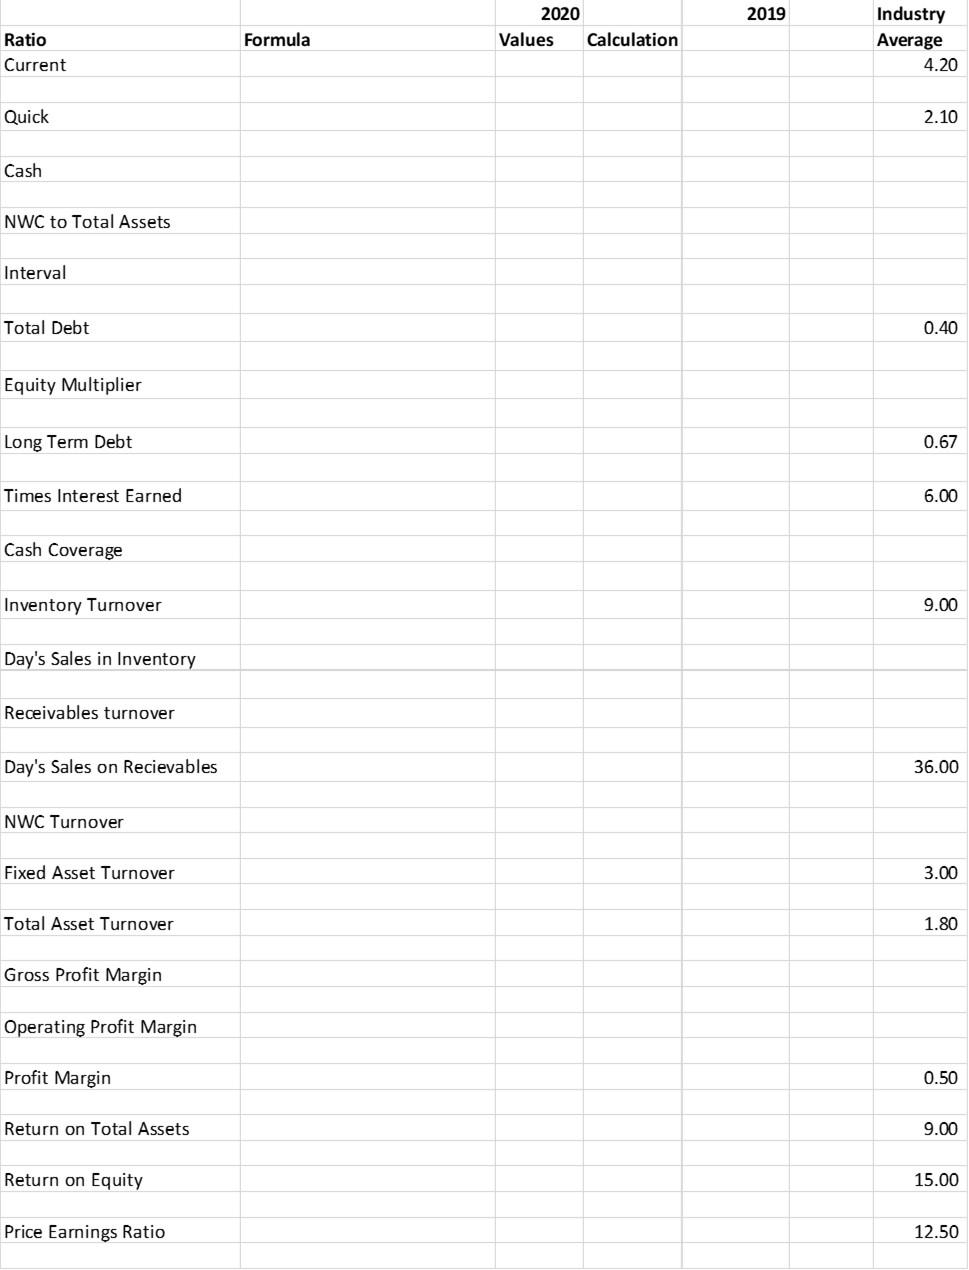
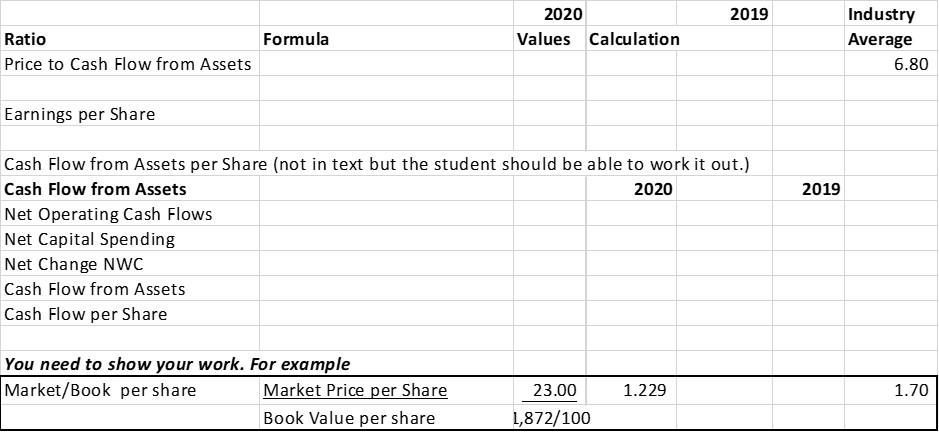
2019 5,700.0 3,534.0 2,166.0 10 Halifax Super Computers Inc. Income Statement ($ millions) 2020 Sales Revenues 6,000.0 Cost of Goods Sold 3,600.0 Contribution Margin 2,400.0 Operating Expenses Salaries 500.0 Wages 625.0 General/Admin 507.4 Amortization Depreciation 200.0 Interest 176.0 Earnings B4 Taxes 391.6 Taxes 156.6 Earnings After tax 235.0 Preferred Dividends 1.0 Net Earnings Appliable to Common 234.0 475.0 593.8 391.2 180.0 120.0 406.0 Halifax Super Computers Inc. Balance Sheet ($ millions) ASSETS 2020 2019 Current Assets Cash 20 30 Short-term Investments 120 Cert. of Deposit Accounts Receivable 750 630 Inventory 1,230 830 Total Current Assets 2,000 1,620 Net Plant & Equipment 2,000 1,740 TOTAL ASSETS 4,000 3,360 LIABILITIES and SHAREHOLDERS' EQUITY Current Liabilities Accounts Payable 120 60 Notes Payable 220 120 Taxes Payable 20 25 Accrued Expenses 260 235 Total Current Liabilities 620 440 Long Term Debt First Mortgage Bonds 1,000 872 Debenture Bonds 508 288 Total Liabilities 1,508 1,160 Equity Preferred Shares 10 10 Common Shares 340 340 Retained Earnings 1,522 1,410 Total Equity 1,872 1,760 TOTAL LIABILITIES AND EQUITY 4,000 3,360 162.4 243.6 1.0 242.6 Shares o/s 100 million 2019 2020 Values Calculation Formula Ratio Current Industry Average 4.20 Quick 2.10 Cash NWC to Total Assets Interval Total Debt 0.40 Equity Multiplier Long Term Debt 0.67 Times Interest Earned 6.00 Cash Coverage Inventory Turnover 9.00 Day's Sales in Inventory Receivables turnover Day's Sales on Recievables 36.00 NWC Turnover Fixed Asset Turnover 3.00 Total Asset Turnover 1.80 Gross Profit Margin Operating Profit Margin Profit Margin 0.50 Return on Total Assets 9.00 Return on Equity 15.00 Price Earnings Ratio 12.50 2019 2020 Values Calculation Formula Ratio Price to Cash Flow from Assets Industry Average 6.80 Earnings per Share 2019 Cash Flow from Assets per Share (not in text but the student should be able to work it out.) Cash Flow from Assets 2020 Net Operating Cash Flows Net Capital Spending Net Change NWC Cash Flow from Assets Cash Flow per Share You need to show your work. For example Market/Book per share Market Price per Share Book Value per share 1.229 1.70 23.00 1,872/100 2019 5,700.0 3,534.0 2,166.0 10 Halifax Super Computers Inc. Income Statement ($ millions) 2020 Sales Revenues 6,000.0 Cost of Goods Sold 3,600.0 Contribution Margin 2,400.0 Operating Expenses Salaries 500.0 Wages 625.0 General/Admin 507.4 Amortization Depreciation 200.0 Interest 176.0 Earnings B4 Taxes 391.6 Taxes 156.6 Earnings After tax 235.0 Preferred Dividends 1.0 Net Earnings Appliable to Common 234.0 475.0 593.8 391.2 180.0 120.0 406.0 Halifax Super Computers Inc. Balance Sheet ($ millions) ASSETS 2020 2019 Current Assets Cash 20 30 Short-term Investments 120 Cert. of Deposit Accounts Receivable 750 630 Inventory 1,230 830 Total Current Assets 2,000 1,620 Net Plant & Equipment 2,000 1,740 TOTAL ASSETS 4,000 3,360 LIABILITIES and SHAREHOLDERS' EQUITY Current Liabilities Accounts Payable 120 60 Notes Payable 220 120 Taxes Payable 20 25 Accrued Expenses 260 235 Total Current Liabilities 620 440 Long Term Debt First Mortgage Bonds 1,000 872 Debenture Bonds 508 288 Total Liabilities 1,508 1,160 Equity Preferred Shares 10 10 Common Shares 340 340 Retained Earnings 1,522 1,410 Total Equity 1,872 1,760 TOTAL LIABILITIES AND EQUITY 4,000 3,360 162.4 243.6 1.0 242.6 Shares o/s 100 million 2019 2020 Values Calculation Formula Ratio Current Industry Average 4.20 Quick 2.10 Cash NWC to Total Assets Interval Total Debt 0.40 Equity Multiplier Long Term Debt 0.67 Times Interest Earned 6.00 Cash Coverage Inventory Turnover 9.00 Day's Sales in Inventory Receivables turnover Day's Sales on Recievables 36.00 NWC Turnover Fixed Asset Turnover 3.00 Total Asset Turnover 1.80 Gross Profit Margin Operating Profit Margin Profit Margin 0.50 Return on Total Assets 9.00 Return on Equity 15.00 Price Earnings Ratio 12.50 2019 2020 Values Calculation Formula Ratio Price to Cash Flow from Assets Industry Average 6.80 Earnings per Share 2019 Cash Flow from Assets per Share (not in text but the student should be able to work it out.) Cash Flow from Assets 2020 Net Operating Cash Flows Net Capital Spending Net Change NWC Cash Flow from Assets Cash Flow per Share You need to show your work. For example Market/Book per share Market Price per Share Book Value per share 1.229 1.70 23.00 1,872/100
Step by Step Solution
There are 3 Steps involved in it

Get step-by-step solutions from verified subject matter experts