

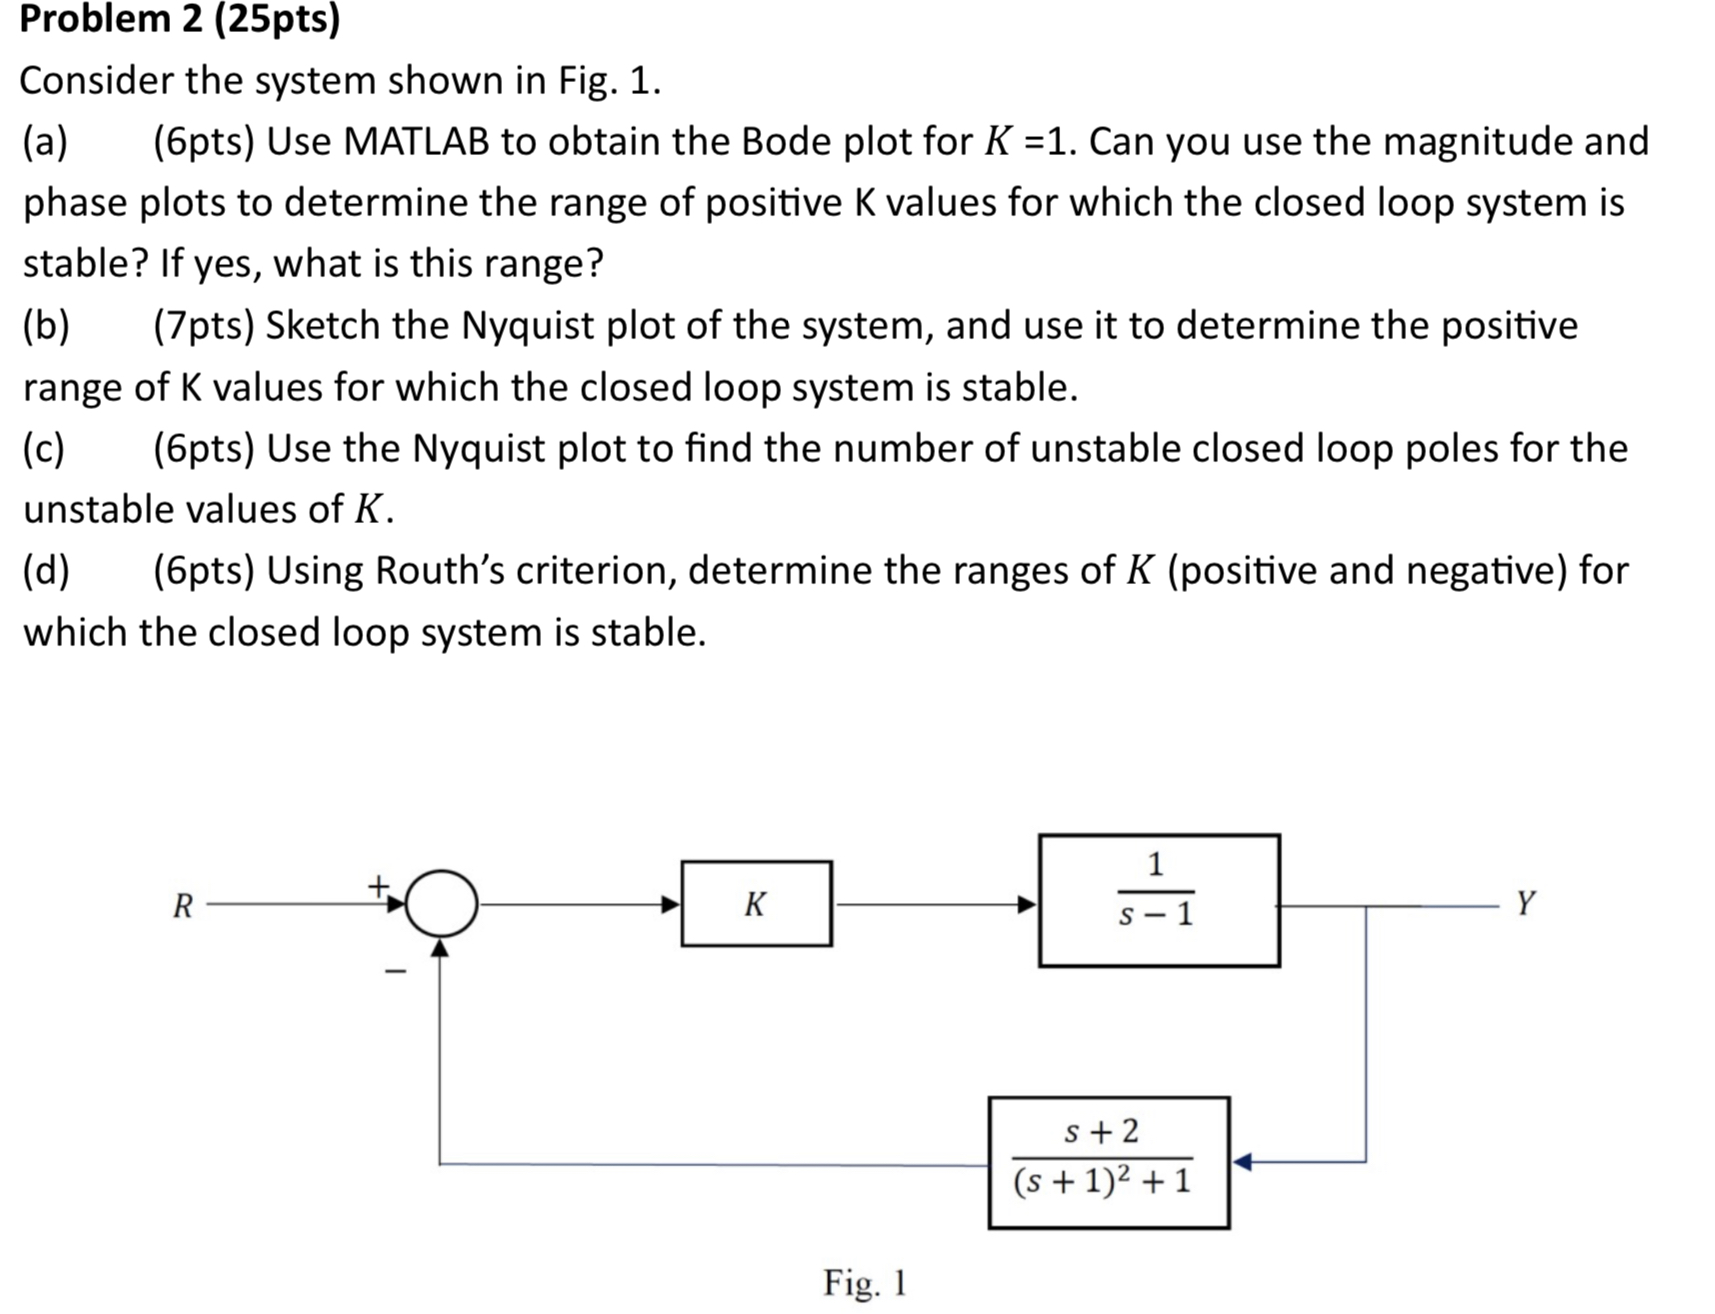
Question: Problem 2 ( 2 5 pts ) Consider the system shown in Fig. 1 . ( a ) ( 6 pts ) Use MATLAB to
Problem pts
Consider the system shown in Fig.
apts Use MATLAB to obtain the Bode plot for K Can you use the magnitude and phase plots to determine the range of positive K values for which the closed loop system is stable? If yes, what is this range?
bpts Sketch the Nyquist plot of the system, and use it to determine the positive range of K values for which the closed loop system is stable.
cpts Use the Nyquist plot to find the number of unstable closed loop poles for the unstable values of K
dpts Using Routh's criterion, determine the ranges of K positive and negative for which the closed loop system is stable.
Step by Step Solution
There are 3 Steps involved in it
1 Expert Approved Answer
Step: 1 Unlock

Question Has Been Solved by an Expert!
Get step-by-step solutions from verified subject matter experts
Step: 2 Unlock
Step: 3 Unlock